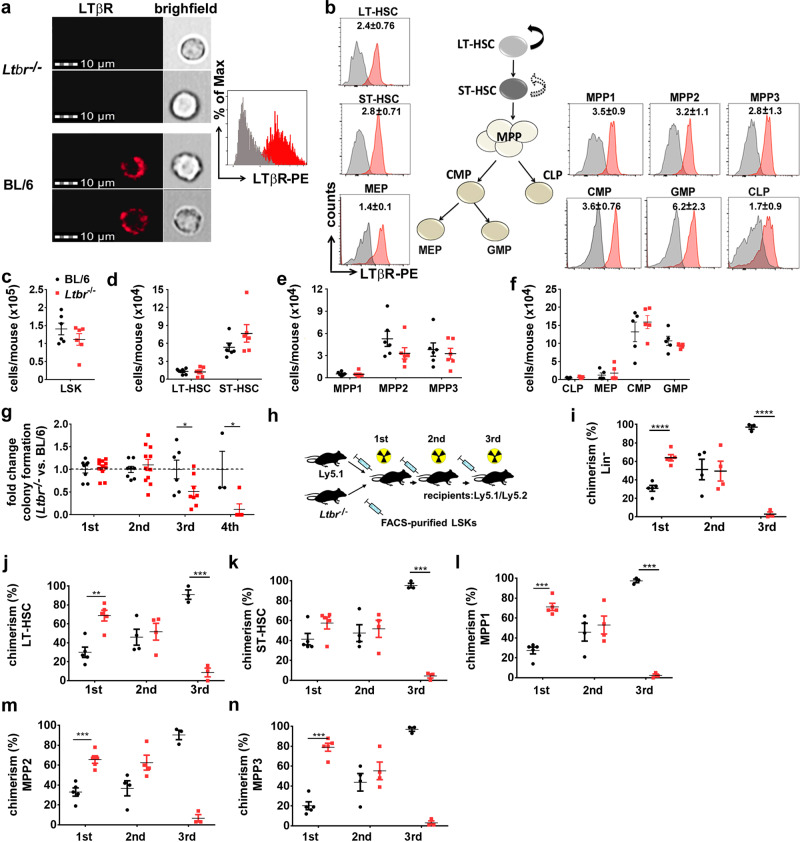
Fig. 1. LTβR expressed by LSKs prevents exhaustion of HSCs.
a Left: LTβR expression (red) on BL/6 and Ltbr−/− FACS-purified BM LSKs analyzed by ImageStreamX MkII. Right: ImageStreamX MkII histogram of LTβR expression on Ltbr−/− LSKs (gray) vs. BL/6 LSKs (red). b Representative FACS histograms of LTβR expression on BM LSK subsets and myeloid progenitor cells. Numbers in plots indicate the ratio MFI stain/isotype (n = 5 mice). c–f Absolute numbers of LSKs (c), LT/ST-HSCs (d), MPPs (e), CLPs and myeloid progenitors (MEP, CMP, GMP) (f) in the BM of naive BL/6 (black, n = 6) and Ltbr−/− (red, n = 6) mice. g Fold change in CFU of Ltbr−/− LSKs relative to BL/6 LSKs in serial re-platings in vitro (1st: n = 8 for BL/6 and 11 for Ltbr−/−; 2nd: n = 8 for BL/6 and 11 for Ltbr−/−; 3rd: n = 6 for BL/6 and 8 for Ltbr−/−; 4th: n = 3 for BL/6 and 5 for Ltbr−/−, one out of two independent experiments). h Schematic of mixed BM chimera and serial re-transplantation. i–n Percentages of Ly5.1 and Ltbr−/− Lin− cells (i) and LSK subsets (j–n), n = 5 (1st), n = 4 (2nd), n = 3 (3rd), one out of two independent experiments is shown. Data are shown as mean ± SEM. Statistics: *P < 0.05, **P < 0.01, ***P < 0.001, ****P < 0.0001 (two-tailed t test); g: 1st p = 0.05, 2nd p = 0.039; i: 1st p < 0.0001, 3rd p < 0.0001; j: 1st p = 0.0012, 3rd p = 0.0003; k: 3rd p < 0.0001; l: 1st p < 0.0001, 3rd p < 0.0001; m: 1st p = 0.0004, 3rd p = 0.0001; n: 1st p < 0.0001, 3rd p < 0.0001.

