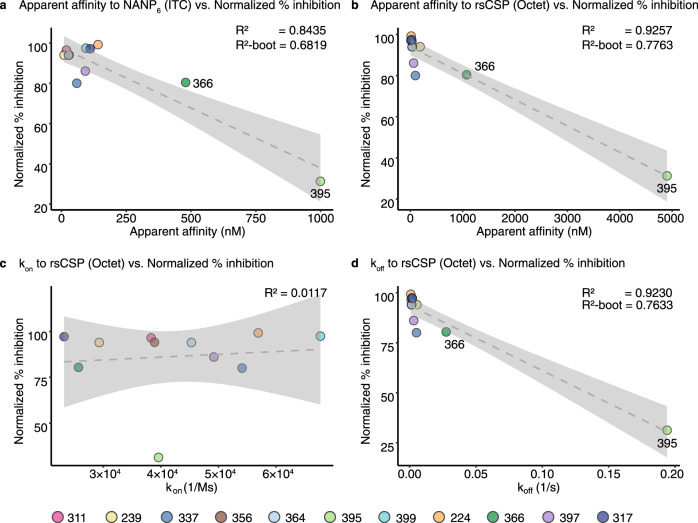
Fig. 3. Correlation of apparent affinity and dissociation constants with normalized parasite burden.
The linear regression graph plots the % inhibition of the parasite liver burden load, normalized across the two mAb panels, against: a Fab apparent affinity as the dissociation constant (Kd) measured to the NPNA6 peptide using isothermal titration calorimetry; (b) Kd, (c) association rate constant (kon), and (d) dissociation rate constant (koff) measured against rsCSP using bio-layer interferometry. The dashed line indicates the fitted linear regression model with 95% confidence interval shaded in grey. The R2 value for each model is displayed, together with the average R2 from 1000 models from bootstrapping (R2-boot). Data points for each mAb are colored as shown. Source data are provided as a Source Data file.

