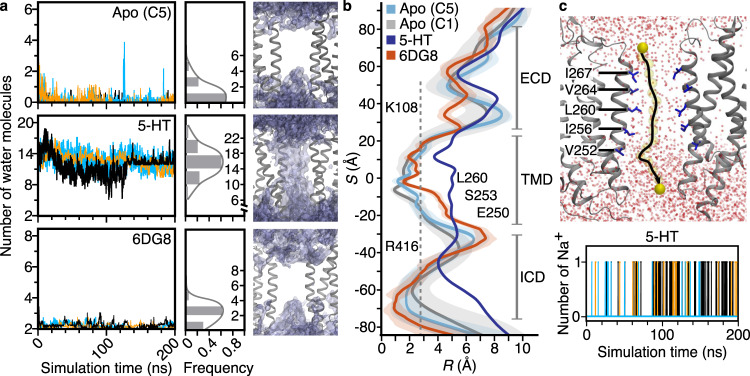
Fig. 4. Pore permeability.
a Averaged water molecule density within 4 Å of L260 at the TMD. Left panel—number of water molecules, solid lines in different colours indicate results of three simulations and the histograms show the averaged distribution of the number of observed water molecules. Right panel—water molecule densities are shown in purple, two subunits of each model shown in grey. b Pore radius (R) profile relative to the distance along the receptor pore axis (S) derived from the MD simulations; solid lines represent the average radii over the last 50 ns of the simulations and shading the corresponding standard deviation. The dashed grey line represents the radius of a hydrated sodium ion (2.76 Å). c Top panel—the trajectory (black line) of a single sodium ion (yellow) translocated across the pore (Supplementary Movie 2). Bottom panel—the number of sodium ions translocated throughout three 200-ns simulations.

