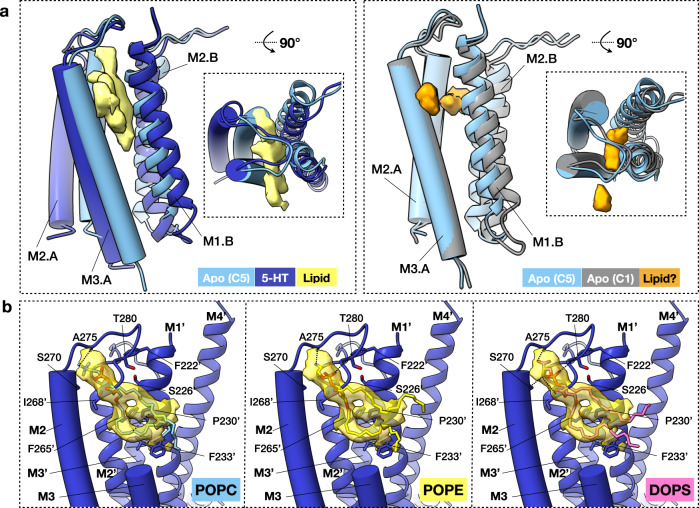
Fig. 7. Inter-subunit lipid-like EM densities.
a Additional densities tentatively assigned as lipids (yellow) were seen in between subunits at the TMD for the serotonin-5HT3R-Salipro EM map (left). Weaker densities were seen in the largest inter-subunit cavity of the apo-C1 EM map (right). b Tentative modelling of POPC (left), POPE (middle), and DOPS (right) in the inter-subunit phospholipid-like density (transparent dark yellow, contoured at σ 2.0) of the serotonin-5HT3R-Salipro EM map. Residues P281-L293 of the M3 helix (of chain A) are omitted for clarity. TMD helices of chain A and B are shown in tube and ribbon representation, respectively.

