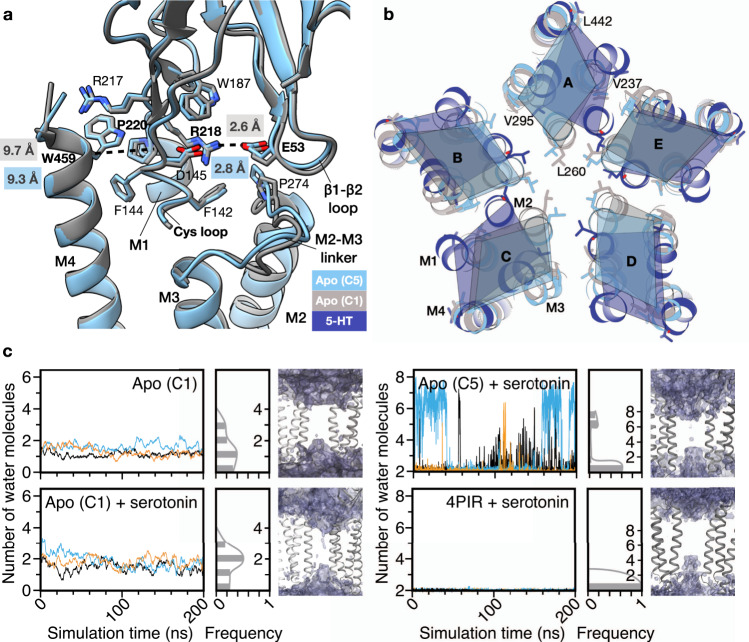
Fig. 8. Comparison of symmetric and asymmetric apo conformations.
a Superposition of apo-C1 (chain C, grey) and apo-C5 5HT3R-Salipro (light blue) structures. Part of M1 and the Cys loop (C135-Y140) are omitted for clarity. The Cα–Cα distance between P220 (pre-M1) and W459 (M4) ranged between 9.6 and 9.9 Å for the individual chains. The Cα–Cα distance between D53 (β1-β2 loop) and R218 (pre-M1) ranged between 2.5 and 3.3 Å. b Cross-section of the TMD at L260 (9′ position) of M2 for apo-C5, apo-C1, and serotonin-bound (dark blue) 5HT3R-Salipro models. Displacement measured at the Cα atoms of residues on each helix in the same cross-section can be found in Supplementary Table 3. Superposition of the models that minimises the summed displacement of the indicated residues is shown. c Graphs show a number of water molecules within 4 Å of L260 at the TMD during MD simulations of apo-C1, and of apo-C1, apo-C5 (in a BPL-mimicking lipid environment) and 4PIR (in POPC) with five serotonin molecules docked into the ligand-binding pockets (+serotonin). Differently coloured lines represent the results of three simulations. Histograms show the averaged distribution of observed water molecules. Figures show water molecule densities in purple, with two subunits of each model shown in grey.

