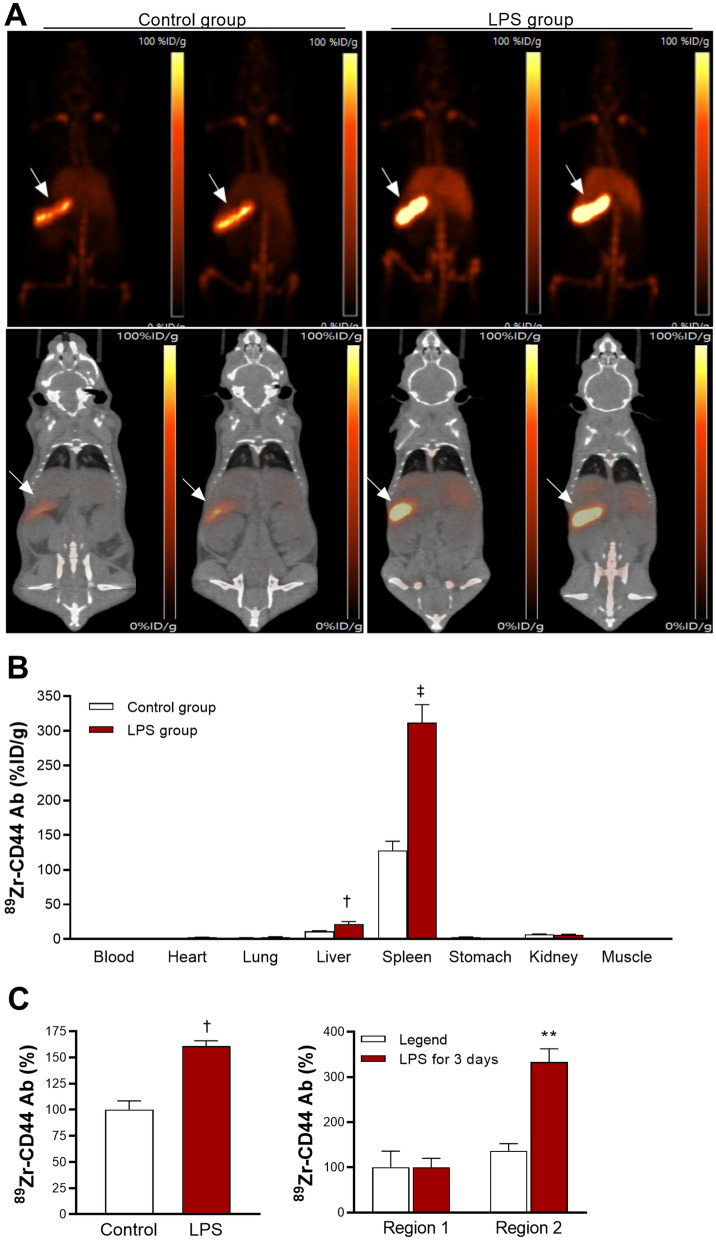
Figure 5.
PET/CT imaging, biodistribution, and splenic cell binding of 89Zr-anti-CD44. (A) Representative maximum intensity projection (MIP) images (top) and coronal (bottom) PET/CT images of two wild type mice per group after daily injection for 3 days with saline (control) or 50 μg/kg LPS. 89Zr-anti-CD44 was injected on the second day, and imaging was performed 4 days later. Arrows indicate splenic uptake. (B) Biodistribution in saline- and LPS-treated mice immediately after PET/CT. (C) Effects of LPS on 89Zr-anti-CD44 uptake in leukocytes obtained from spleens of normal naive mice. On the left are unsorted splenic leukocytes, and on the right are cells from R1 and R2. Bars are mean ± S.D. of %ID/g obtained from 4 animals per group (B) or % activity obtained from triplicate samples (C). **P > 0.01; †P > 0.005; ‡P > 0.001, compared to controls.

