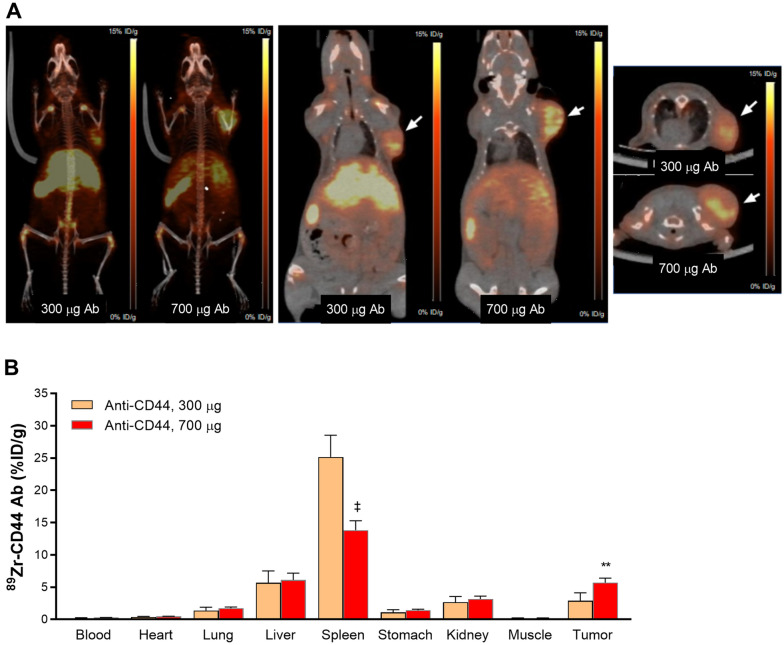
Figure 6.
PET/CT imaging and biodistribution of 89Zr-anti-CD44 in tumor bearing mice. (A) Representative MIP (left), coronal (middle), and transaxial (right) PET/CT images of HT29 tumor- bearing Balb/c nude mice at 4 days after injection of 89Zr-anti-CD44 with 300 or 700 ng total Ab doses. Arrows indicate tumor uptake. (B) Biodistribution at 4 days after injection of 89Zr-anti-CD44 with 300 or 700 ng total Ab doses. Bars are mean ± S.D. of %ID/g obtained from four animals per group. **P > 0.01; ‡P > 0.001.

