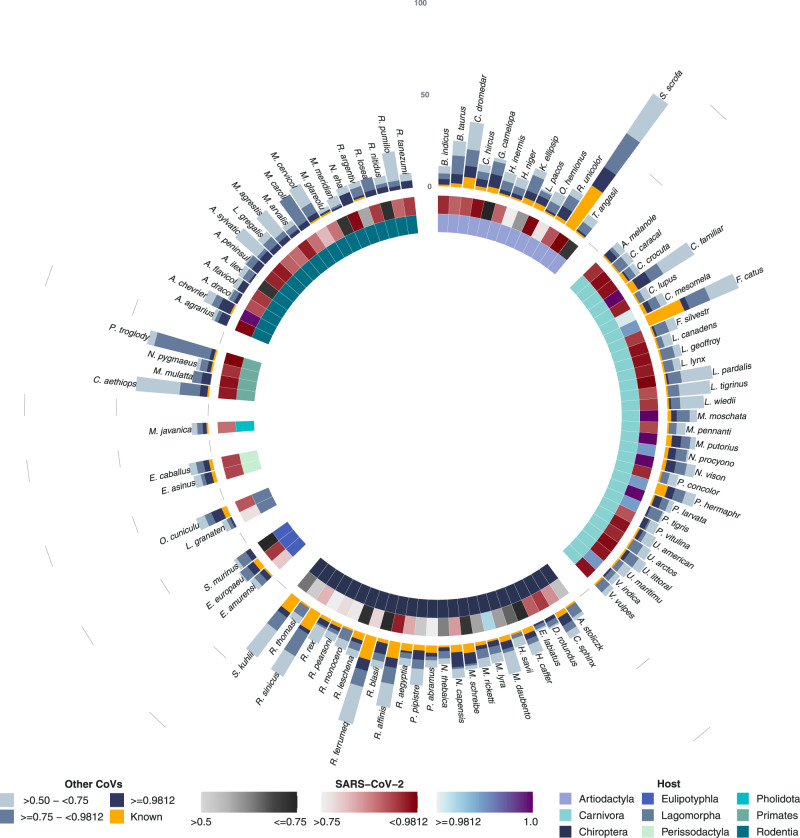
Fig. 1. Model predictions for potential hosts of SARS-Cov-2.
Predicted hosts are grouped by order (inner circle). Middle circle presents probability of association between host and SARS-CoV-2 (grey scale indicates predicted associations with probability in range > 0.5 to ≤0.75. Red scale indicates predicted associations with probability in range > 0.75 to <0.9821. Blue to purple scale present indicates associations with probability ≥ 0.9821). Yellow bars represent number of coronaviruses (species or strains) observed to be found in each host. Blue stacked bars represent other coronaviruses predicted to be found in each host by our model. Predicted coronaviruses per host are grouped by prediction probability into three categories (from inside to outside): ≥0.9821, >0.75 to <0.9821 and >0.5 to ≤0.75. Results for humans and lab rodents are not shown to prevent the scale from contracting and making other comparisons difficult. Supplementary Fig. 14 illustrates full results including these hosts. Full results are listed in Supplementary Data 1.

