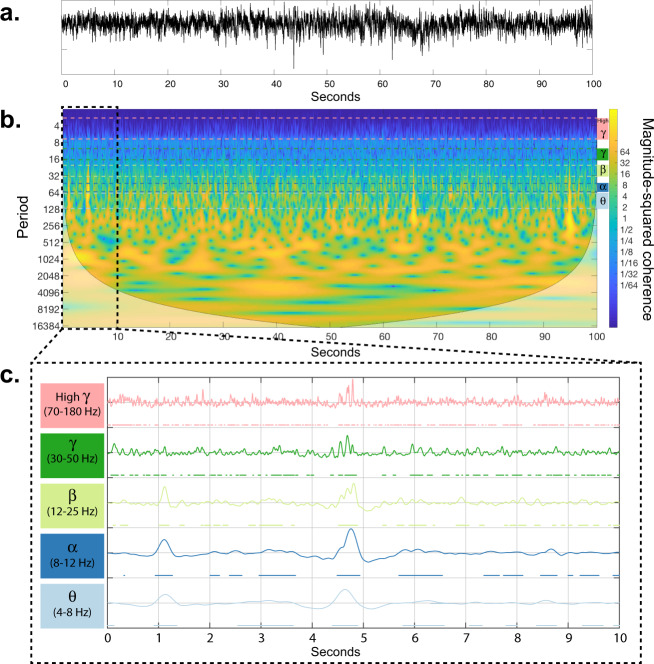
Fig. 1. Construction of power amplitude states from iEEG time-series.
a The raw iEEG time-series recorded from a sample electrode. b A wavelet decomposition of 100 s of raw iEEG time-series81. Color-coded dashed lines show the θ, α, β, γ, and high γ frequency bands. c The average power of all frequencies within each band is high-pass filtered at 0.5 Hz, and normalized to obtain a z-score. The resultant time series were then thresholded at zero separately for each band, to create the binarized power amplitude states on which the MEM operates. Note that the ‘on’ states are marked by color-coded dots under each curve.

