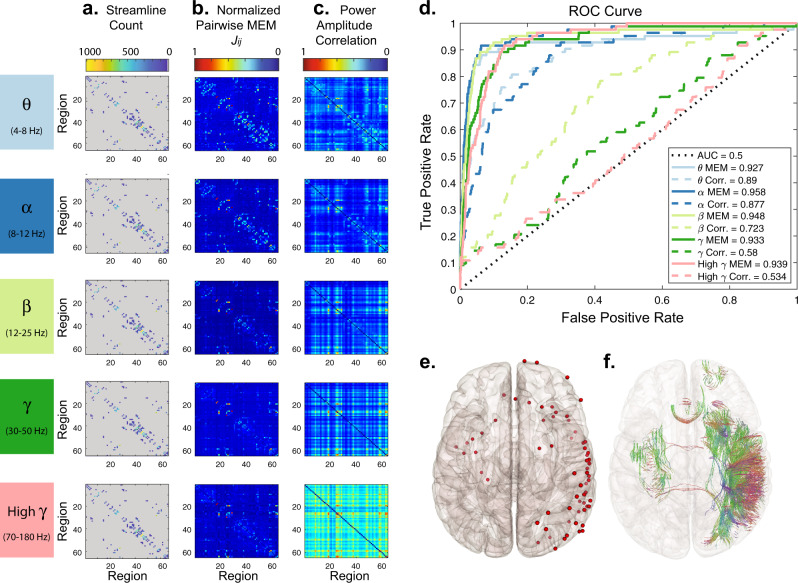
Fig. 4. Predicting structural connectivity from estimates of functional connectivity.
a A structural connectivity matrix from a single representative patient (#5), each element of which indicates the number of streamlines estimated between a pair of brain regions. b The interaction matrices, Jij, obtained from 19 h of inter-ictal iEEG power amplitude states (referential montage, binarization threshold = 0) using the pairwise MEM. c The functional connectivity matrices estimated from band-passed binarized power amplitude correlations (i.e., co-activation rates). For regions covered by multiple electrodes, we selected only the electrode closest to the region’s centroid for display in these plots as well as in the ROC analysis. d ROC curves for identification of anatomically connected regions based on interaction matrices (solid lines) and band-passed power amplitude correlations (dashed lines). Lines are color-coded based on the frequency band. e Brain overlay providing the position of the selected electrodes (red dots). f Streamlines connecting the regions covered by the selected electrodes in the same patient. Here the 3-dimensional orientations of the streamlines are coded by color.

