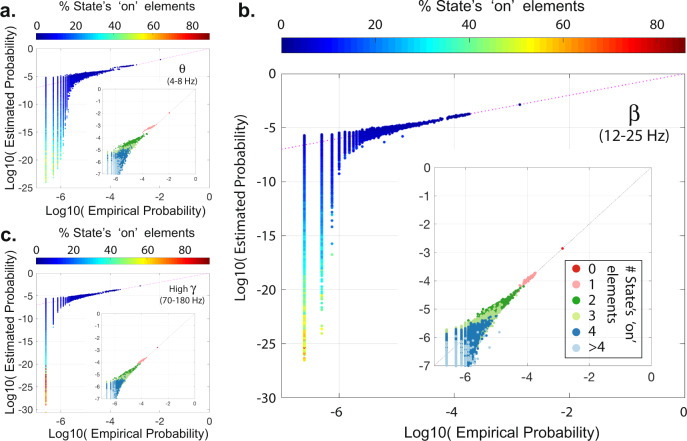
Fig. 7. Empirical and estimated probabilities of all observed states.
Plots represent the empirical and estimated probabilities of all observed states from a representative patient (#5) at θ(a), β(b), and High γ(c) bands using local montage and state binarization threshold of ‘1’. The co-activation states’ size (i.e., the percentage ‘on’ elements of states) is color-coded based on the color bar on top of each panel. Insets depict the highest probability states within their respective frequency band. States in the inset-plots are also color-coded based on the number of ‘on’ elements of each state (see panel b for color-code legend). Supplementary Fig. 15 shows the results for all five patients.

