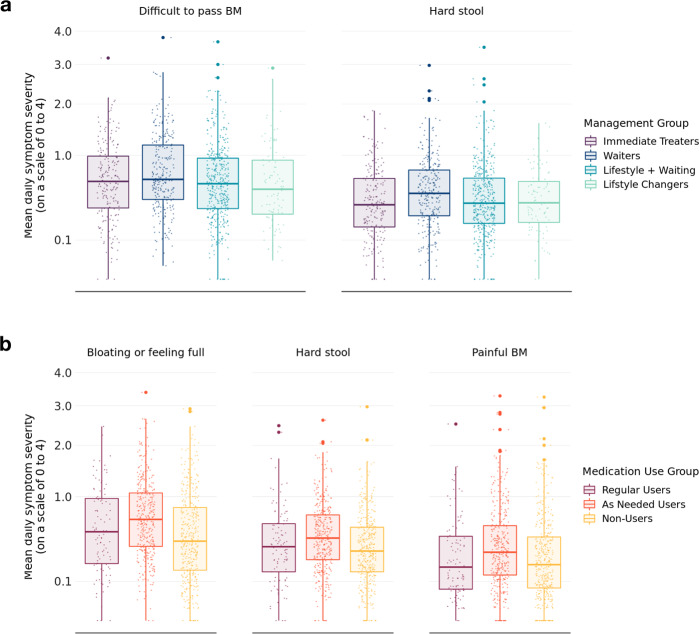
Fig. 3. Boxplots of symptom severity.
a A boxplot of symptom severity on self-reported management approach from the monthly surveys. b A boxplot of symptom severity on medication use approach from the monthly surveys. Symptoms scores in each group are on a 0–4 scale with 4 as the most severe symptom. Each boxplot shows the median (center line) and inter-quartile range (box bounds) and the largest (top whisker) and smallest (bottom whisker) values within 1.5* interquartile. Only significant results are shown.

