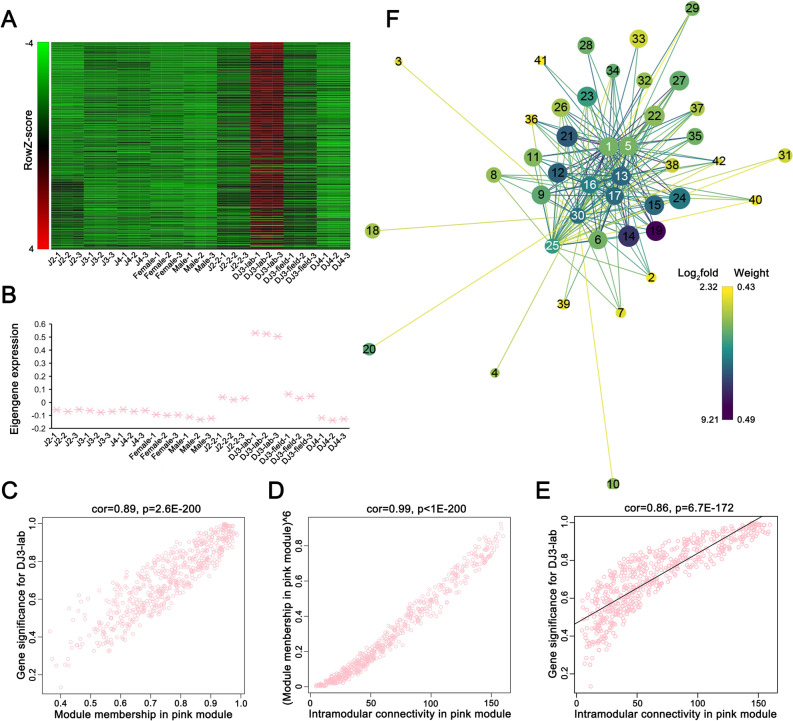
Figure 3.
Weighted gene coexpression analysis (WGCNA) revealed a gene-network module enriched in Bursaphlenchus xylophilus DJ3-lab. (A) Heatmap of the pink module genes (rows) across the samples (columns). (B) The pink module eigengene expression values (y-axis) across the samples (x-axis) (C) GS for DJ3-lab vs. MM in the pink module. (D) MM raised to power 6 (y-axis) vs. IC (x-axis) for the pink module. (E) GS (y-axis) vs. IC (x-axis) for the pink module. (F) Gene network for the 7 selected genes in the pink module with the top 30 highest GS to DJ3-lab (detailed in Table S4 and Table S5). Prefuse Force Directed Layout was applied based on the weight value between two genes. The size of the dots represents GS (from 0.9361 to 0.9984). The color of the dots represents log2fold (from 2.3238 to 9.2053) for the FPKM of DJ3-lab vs. the average FPKM of the other samples. The colors of the lines represent the weight value between two genes (from 0.4330 to 0.4921). The label of dots is listed based on IC (from 97.0445 to 159.5326), and the 7 selected dots are highlighted with white color labels.

