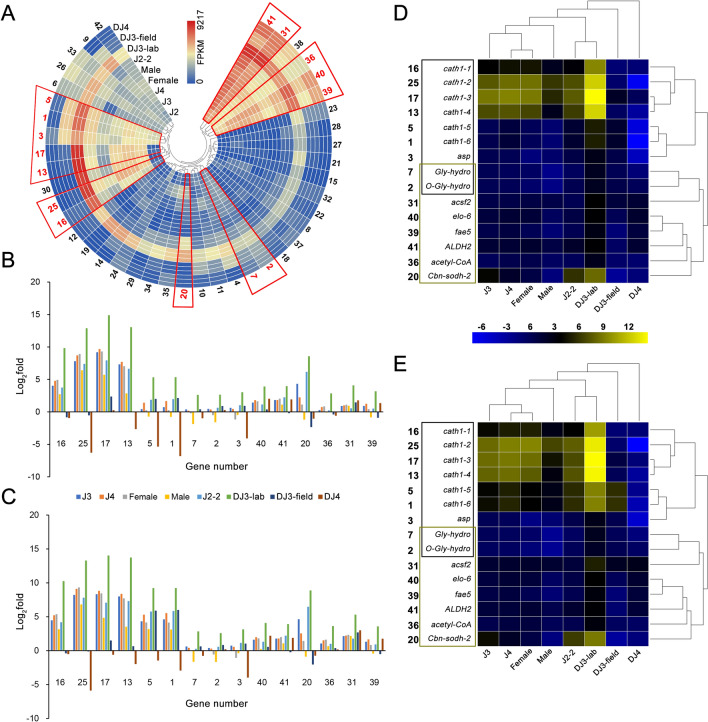
Figure 4.
The expression pattern of 7 CATH1 homologous genes with the top 30 highest GS values to the DJ3-lab and their top 30 related genes in the pink module. (A) The expression (FPKM) of 42 genes in the pink module include 7 CATH1 homologous genes with the top 30 highest GS values to the DJ3-lab and their top 30 related genes. Genes are clustered by their expression pattern. The 15 genes associated with lipid metabolism or autophagy are framed in red. (B) Comparison of the relative transcript abundances of the 15 lipid metabolism- or autophagy-associated genes from different PWN stages (normalized by J2) by FPKM. (C) Comparison of the relative transcript abundances of the 15 lipid metabolism- or autophagy-associated genes from different PWN stages (normalized by J2) by RT-PCR. (D) Heatmap and clustering analysis of the results from (B). (E) Heatmap and clustering analysis of the results from (C). Genes in the black box are associated with autophagy, while those in the khaki box are associated with lipid metabolism.

