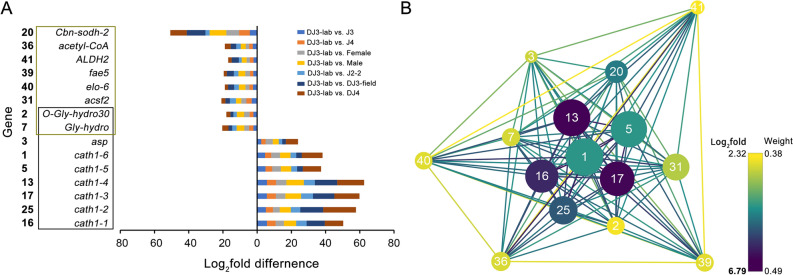
Figure 5.
Gene expression difference and network for the 15 lipid metabolism- or autophagy-associated genes selected from the pink module. (A) The FPKM differences (normalized by J2) between DJ3-lab and the other PWN stages. Genes in the black box are associated with autophagy, while those in the khaki box are associated with lipid metabolism. (B) Gene network for the 15 candidate genes. The size of the dots represents GS (from 0.9361 to 0.9984). Prefuse Force Directed Layout was applied based on the weight value between two genes. The color of the dots represents log2fold (from 2.3238 to 6.7868) for the FPKM of DJ3-lab vs. the average FPKM of the other samples. The color of the lines represents the weight value between the two genes (from 0.3770 to 0.4864). The label of dots is listed based on IC (from 108.1303 to 159.5326).

