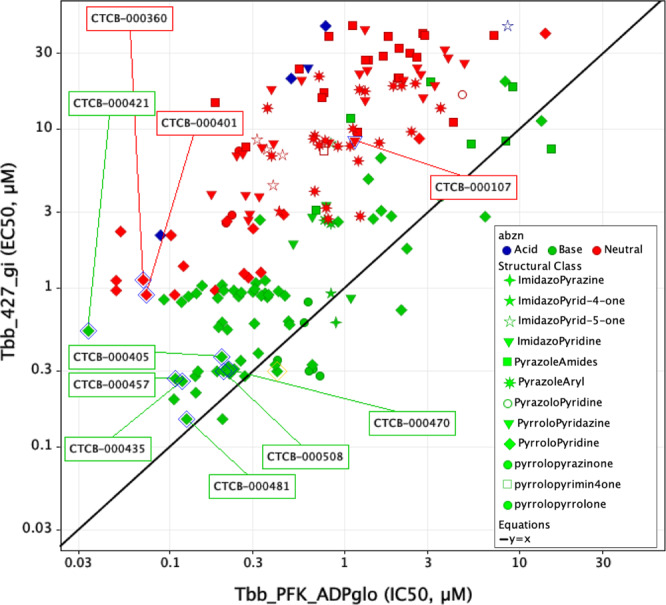
Fig. 4. EC50 versus IC50 values for CTCB compounds.

Each compound in the CTCB series was tested against T. brucei in an in vitro killing assay and also tested in an enzyme inhibition assay against TbPFK. The Y-axis-labelled Tbb_427_gi gives the EC50 values for the growth inhibition assay (Supplementary Methods 4) and the X-axis-labelled Tbb_PFK_ADPglo gives IC50 values for the enzyme inhibition assay (Supplementary Methods 2.1). The compounds are colour coded according to charge (green = basic, red = neutral and blue = acidic). The plot shows that for a wide variety of structural classes (denoted by shape of the data point), there is a better translation from IC50 to EC50 for the basic molecules and that the effect of pKa on parasite killing appears to be consistent across different structural classes (though only details of the pyrrolopyridine class are described in this communication). The pKa values were calculated using ChemAxon software and categorised assuming physiological pH of 7.8.
