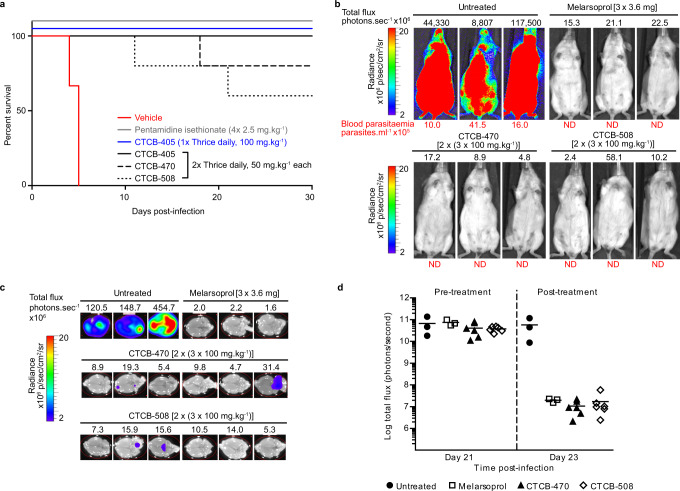
Fig. 7. CTCB compounds clear parasites in a stage 1 model of HAT infection with 1-day oral dosing and show reduction of parasitaemia in the brain in a pleiomorphic model.
a Kaplan–Meier survival curve depicting cure in T. b. brucei Lister 427-infected mice treated with CTCB-405 (solid line, blue), with no recurrence of parasitaemia 30 days post infection. Three doses of CTCB-405 at 100 mg kg−1 were administered 2 h apart on a single day (n = 5). The curves also demonstrate either complete clearance or a significant increase in survival of mice orally dosed thrice daily at 50 mg kg−1 over 2 days (n = 5) with CTCB-405 (solid line, black), CTCB-470 (dashed line, black) or CTCB-508 (dotted line, black) (p < 0.0001). Control mice were administered either vehicle only (n = 3; solid line, red) or four single daily doses of 2.5 mg kg−1 pentamidine isethionate intraperitoneally (n = 3; solid line, grey). Survival of mice was assessed for 30 days post infection. Mice were euthanised upon detection of first visible parasites in blood samples by microscopy. b Bioluminescence live imaging of T. b. brucei GVR35 after treatment (day 23) to evaluate parasitaemia in vivo. Infected mice were treated topically with three doses of 3.6 mg melarsoprol over 3 days (n = 3) or orally with six doses of CTCB compounds (CTCB-470 or CTCB-508) at 100 mg kg−1 over 2 days (n = 6, only three mice from each batch are shown; Melarsoprol is a toxic anti-stage 2 HAT drug used as a positive control). Whole body bioluminescence (total flux in photons per second, above image) and blood parasitaemia (in parasites mL−1, below image) for three representative mice from each group is shown. c At day 23 mice shown in b were perfused with saline; brains were removed, soaked in luciferin and imaged to detect bioluminescent parasites (bioluminescence of brains imaged ex vivo on day 23 quantified in Supplementary Fig. 12 and side head images of mice shown in Supplementary Fig. 13). d Whole body bioluminescence pre- (day 21) and post-treatment (day 23) of infected mice shown in b (n = 3 for untreated and melarsoprol-treated mice and n = 6 for both CTCB-470 and CTCB-508-treated mice).

