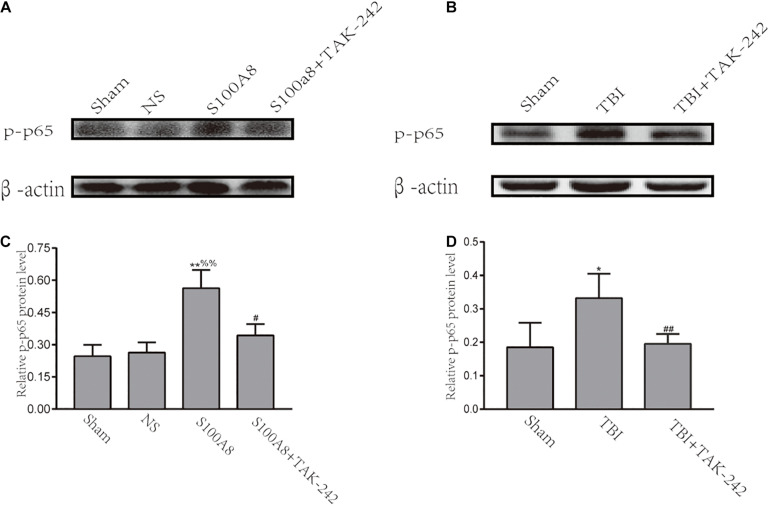
FIGURE 3.
Involvement of the NF-κB activation after S100A8 stimulation and TBI. (A,C) The representative Western blot bands and statistical analysis of the p-p65 expression in the different groups after the intracerebroventricular injection of the S100A8 protein; (B,D) The representative Western blot bands and semi-quantitative analysis of the p-p65 expression in the different groups after TBI in mice. The data was presented as mean ± standard deviation (SD; n = 6, per group); ∗P < 0.05 and ∗∗P < 0.01 compared to the sham group; #P < 0.05 and ##P < 0.01, when compared to the S100A8 or TBI group. %%P < 0.01 compared to the NS group.

