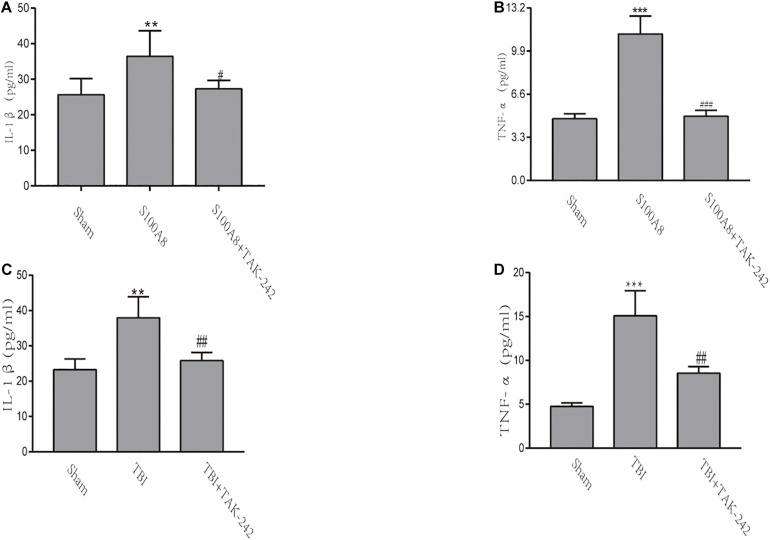
FIGURE 4.
The detection of inflammatory cytokines through ELISA in vivo. (A,B) TNF-α and IL-1β levels were determined by ELISA after the intracerebroventricular injection of the S100A8 protein. (C,D) The pro-inflammatory cytokine production in the sham group at 24 h post-TBI, and the TAK-242 treatment of TBI mice. The data was presented as mean ± standard deviation (SD; n = 3, per group). ∗∗P < 0.01 and ∗∗∗P < 0.001, compared to the sham group; #P < 0.05, ##P < 0.01 and ###P < 0.001, when compared to the S100A8 or TBI group.

