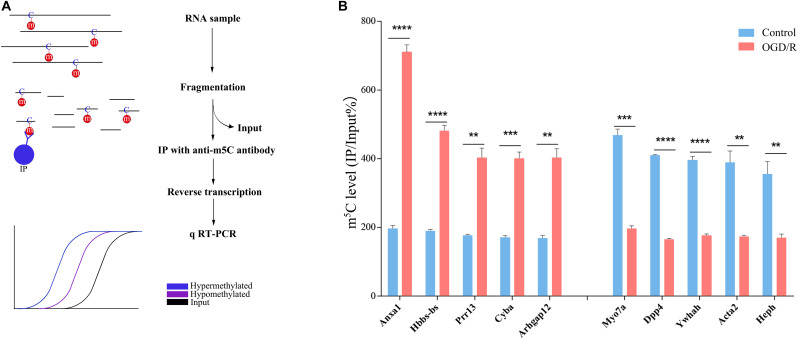
FIGURE 2.
verification of m5C methylation positions. (A) Illustration of the MeRIP approach. RNA was extracted from neurons, chemically lysed and then divided into the IP group and input group. The IP group was incubated with anti-5-methylcytosine antibody. Finally, the expression level of candidate transcripts was analyzed by qRT-PCR. The blue line represents the hypermethylated transcripts, the purple line represents the hypomethylated transcripts, and the black line indicates the enrichment of the input group. (B) m5C level changes in 5 candidate hypermethylated transcripts and 5 candidate hypomethylated transcripts in the control and OGD/R groups (fold change > 2, p < 0.01). **p < 0.01; ***p < 0.001; ****p < 0.0001.

