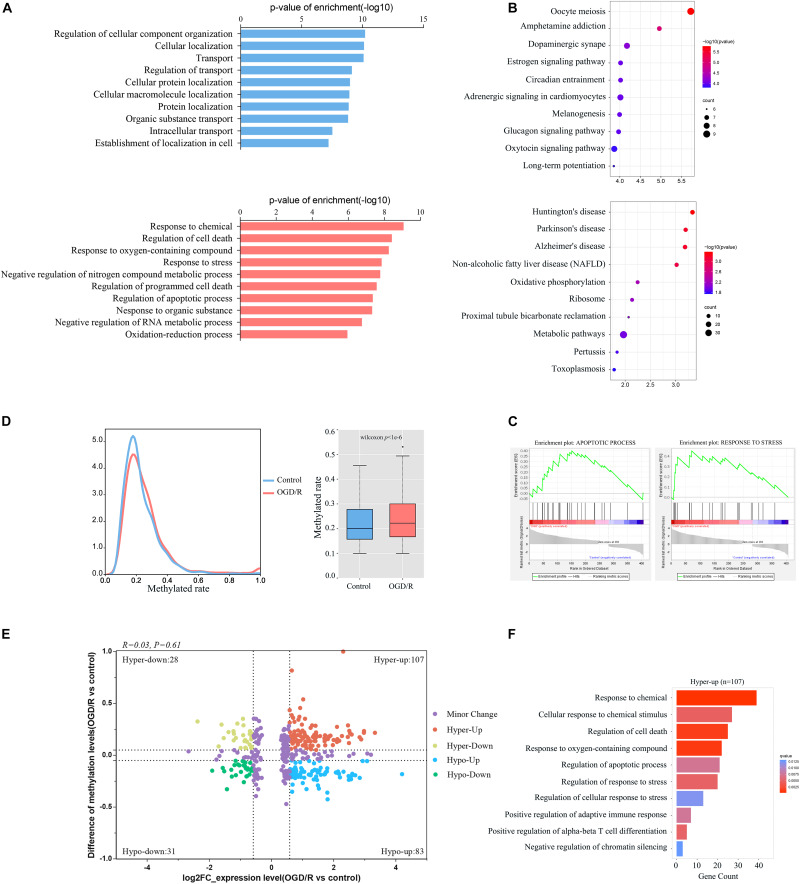
FIGURE 6.
Integration analyses of m5C-containing mRNA methylation and mRNA transcript expression. (A) GO biological process analyses of DEGs modified by m5C in control and OGD/R neurons. (B) KEGG analysis of DEGs modified by m5C in the control group and OGD/R group. (C) GSEA of DEGs modified by m5C with Gene Ontology sets. (D) Comparison of m5C levels in mRNAs between the control group and OGD/R group, density distribution plot (left), and box plot (right). (E) mRNA distributions with significant changes in gene expression and m5C modification levels between the control group and OGD/R group. (F) GO biological process analysis of hypermethylated mRNAs with upregulated genes after OGD/R treatment.

