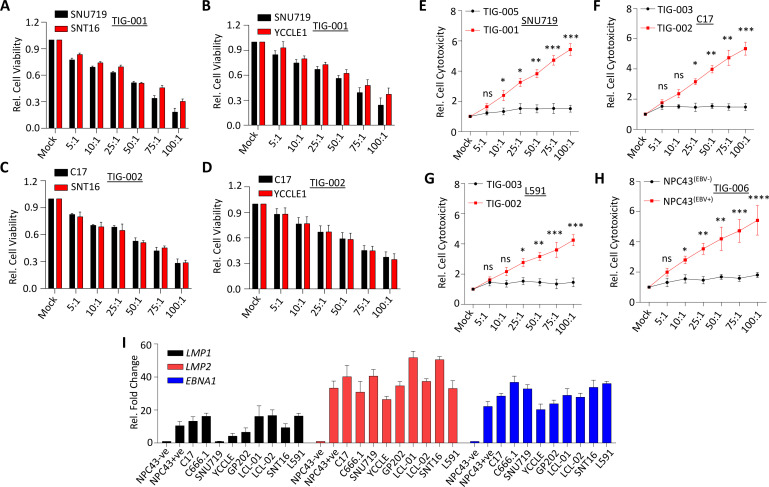
Figure 2.
In vitro recognition of multiple EBV-associated cancer cells by HLA-matched allogeneic EBV-specific T-cells. (A–D) Cell viability was measured by MTS assay following the exposure for 24 hours of EBV-positive cancer cells SNU719, SNT16 (A), SNU719 and YCCLE1 (B), C17 and SNT16 (C) and C17 and YCCLE1 (D) to HLA-matched TIG-001 and TIG-002 allogeneic EBV-specific T cells across varying effector-to-target (E:T) ratios (5:1–100:1). (E–H) Cytotoxicity was measured by LDH release following the exposure for 24 hours of EBV-positive and EBV-negative cancer cells SNU719 (E), C17 (F), L591 (G) and EBV-positive and EBV-negative NPC43 cells (H) to HLA-matched and HLA-mismatched allogeneic EBV-specific T cells across varying E:T ratios (5:1–100:1). HLA alleles that were matched between the T-cell products and the cancer cell lines are underlined in table 1 and online supplemental table 1. (I) Representation of relative fold expression of LMP1, LMP2 and EBNA1 at mRNA level in each cell line. The expression of these genes is represented as a relative fold change in EBV-positive with respect to EBV-negative (NPC43– cancer cells). Housekeeping genes HPRT1 and 18sRNA were used as controls. PBS was used as mock treatment across all experiments. Error bars corresponds to mean ± SD from three independent experiments. P values were calculated using Student’s t-test. *p<0.05, **p<0.01, ***p<0.001. EBNA1, EBV-encoded nuclear antigen 1; EBV, Epstein-Barr virus; HLA, human leukocyte antigen; LDH, lactate dehydrogenase; LMP1, latent membrane protein 1; LMP2, latent membrane protein 2; NPC, nasopharyngeal carcinoma; ns, not significant.

