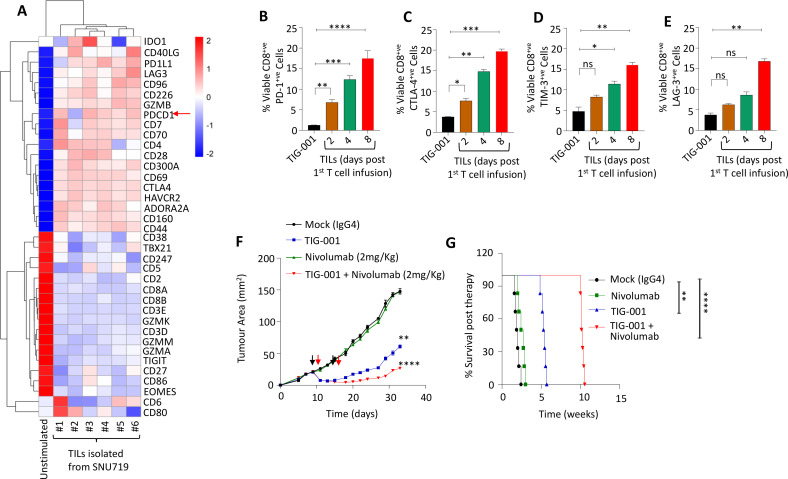
Figure 7.
Impact of PD-1 inhibition on therapeutic efficacy of allogeneic EBV-specific T cells in vivo. (A) Heat map representing the gene signature of the checkpoint genes at the transcript level, observed from CD8+ TILs, performed using a customized NanoString immune function panel. The TILs were isolated from SNU719-derived tumor xenografts (n=6) 5 days after a single infusion of TIG-001 T cells. The gene expression observed in TILs was compared with T cells in the TIG-001 product. (B–E) The percentage of CD8+ TILs expressing PD-1, CTLA4, TIM-3 or LAG3 when compared with TIG-001 T cells. Error bars represent the mean ± SD from three independent experiments. P values were calculated using one-way ANOVA. (F) Tumor growth kinetics of the SNU719 xenograft following monotherapy-based adoptive T-cell therapy, anti-PD-1 (2 mg/kg), or a combination therapy based on two infusions of TIG-001 T cells (2×10⁷ cells/mouse/dose) and two doses of anti-PD-1 (each dose given 24 hours after T-cell treatment). The tumor growth is represented as the mean tumor area ± SD from n=8 mice/group. (G) Kaplan-Meier overall survival analysis of mice bearing the SNU719 xenograft following treatment with monotherapy or combination therapy. PBS was used as mock treatment across all experiments. Survival was monitored over the indicated period (n=5 mice/group) and statistical significance was assessed by log‐rank test: *p<0.05, **p<0.01; ***p<0.001; ****p<0.0001. ANOVA, analysis of variance; CTLA-4, cytotoxic T-lymphocyte-associated protein-4; EBV, Epstein-Barr virus; LAG-3, lymphocyte-activation gene-3; PD-1, programmed cell death protein-1; TILs, tumor-infiltrating lymphocytes; TIM-3, T-cell immunoglobulin and mucin-domain containing-3.

