Figure 4.
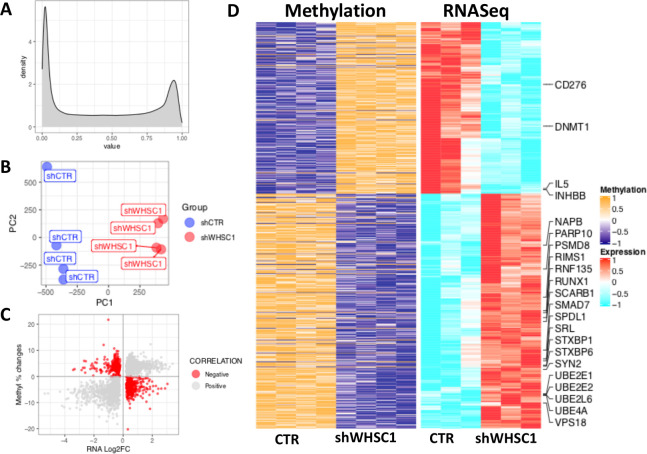
Methylomic data analysis following WHSC1 knockdown in C42 cells. (A) Distribution of the beta values in our methylomic analysis. (B) PCa analysis of the normalized methylation data; values were scaled and centred prior to PCa analysis. Blue and red dots indicate controls (shCTR) and knockdown (shWHSC1) samples, respectively. (C) Scatterplot showing the relationship between the changes in percentage methylation and gene expression following WHSC1 knockdown. Red dots highlight genes with negative correlation (high methylation, low expression and vice versa) that were selected (D) Heatmap visualization of the methylation intensity versus expression values, highlighting genes that belong to immune and APM pathways. For methylation data (left), orange and blue indicate high and low intensity/beta values, respectively; for RNAseq data, red and cyan indicate high and low gene expression, respectively. APM, antigen processing and presentation machinery; CTR, control; PCa, prostate cancer; WHSC 1, Wolf-Hirschhorn syndrome candidate 1.

