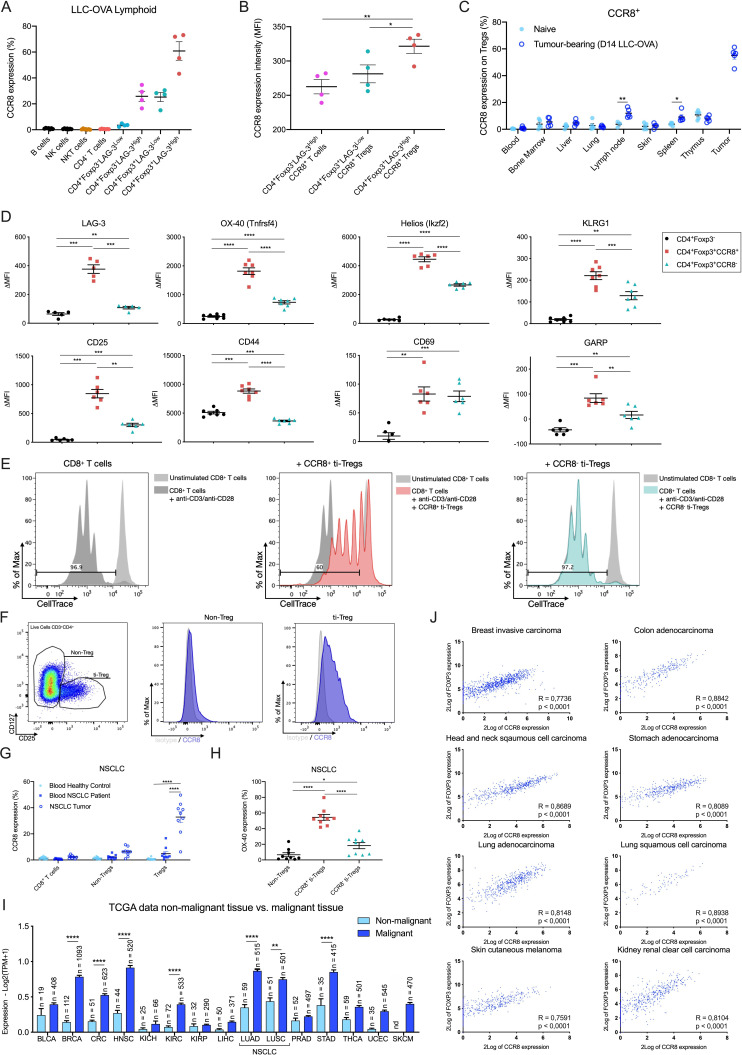
Figure 3.
CCR8 is mainly expressed on the highly activated ti-Tregs. (A) Percentage CCR8+cells within different LLC-OVA tumor-infiltrating lymphoid cell subsets as measured via flow cytometry (n=5). (B) CCR8 expression level (MFI) on the CCR8+ tumor-infiltrating T-cell populations as measured via flow cytometry (n=4). (C) Percentage CCR8+cells within Tregs in different organs of tumor-bearing (dark blue) and naive C57BL/6 mice (light blue) as measured via flow cytometry (n=5). (D) Expression (ΔMFI) of LAG-3, OX-40, Helios, KLRG1, CD25, CD44, CD69 and GARP in the CD4+Foxp3- (black circle), CD4+Foxp3+CCR8+ (red square) and CD4+Foxp3+CCR8- (turquoise triangle) T-cell subsets as determined via flow cytometry (n=6). (E) Treg suppression assay. Splenic CD8+ T-cell proliferation after stimulation (anti-CD3+anti-CD28) in the presence of CCR8+ (red) or CCR8− (turquoise) ti-Tregs at a ratio of one ti-Treg for five splenic T cells (1:5). (F) Representative flow cytometry plots showing Isotype/CCR8 expression (MFI) by non-Tregs and ti-Tregs of NSCLC patients. (G) Percentage CCR8+cells within different lymphoid subsets found in the blood or tumors of patients with NSCLC or healthy volunteers as measured via flow cytometry (n=9-11). (H) Percentage OX-40+cells within different lymphoid subsets found in the tumors of patients with NSCLC as measured via flow cytometry (n=9). (I) Expression of the CCR8 gene within cancerous and surrounding healthy tissue of bladder urothelial carcinoma (BLCA), breast invasive carcinoma (BRCA), colorectal cancer (CRC), head and neck squamous cell carcinoma (HNSC), kidney chromophobe (KICH), kidney renal clear cell carcinoma (KIRC), kidney renal papillary cell carcinoma (KIRP), liver hepatocellular carcinoma (LIHC), lung adenocarcinoma (LUAD), lung squamous cell carcinoma (LUSC), prostate adenocarcinoma (PRAD), stomach adenocarcinoma (STAD), thyroid carcinoma (THCA), uterine corpus endometrial carcinoma (UCEC) and skin cutaneous melanoma (SKCM) (data retrieved from TCGA). (J) Correlation between the expression of FOXP3 and CCR8 in different human tumors (data retrieved from TCGA). (A to D and G to I) Data shown as mean±SEM. (B, D, G, H) *p<0.05, **p<0.01, ***p<0.001 and ****p<0.0001 by one-way ANOVA, (C, I) *p<0.05, **p<0.01 and ****p<0.0001 by (un)paired Student’s t-test. ANOVA, analysis of variance; LLC, Lewis Lung Carcinoma; NK, natural killer; NSCLC, non-small cell lung carcinoma; TCGA, The Cancer Genome Atlas; ti-Treg, tumor-infiltrating regulatory T cell.

