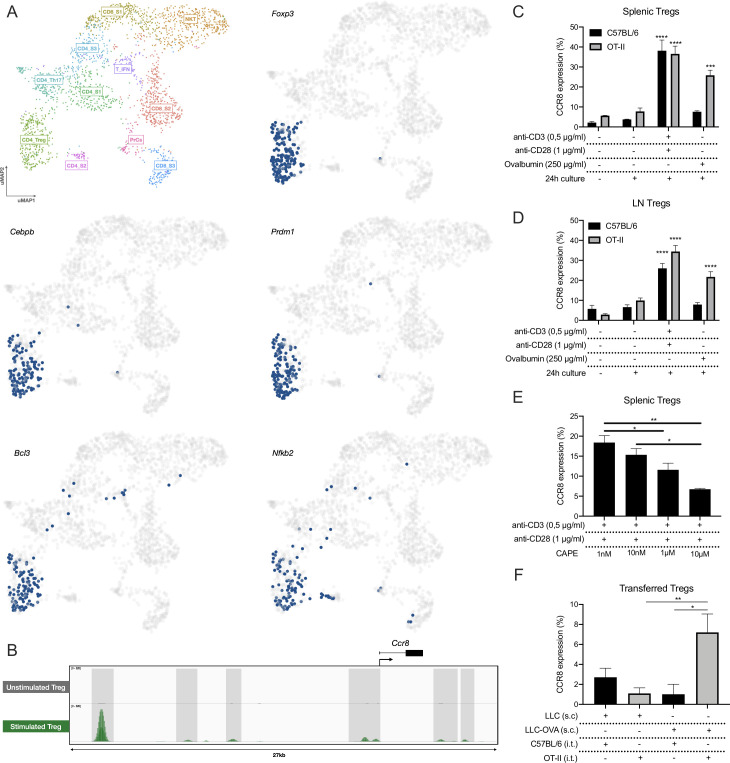
Figure 4.
CCR8 upregulation is induced by TCR stimulation. (A) UMAP plots showing the activity of the Foxp3, Cebpb, Prdm1, Bcl3 and Nfkb2 regulons within the distinct T-cell subsets, cells in which the regulons are active are indicated in blue. (B) ChIP-seq (p65) signal profiles across the Ccr8 locus. Data obtained from Oh et al.42 Peaks that are gained after Treg stimulation are highlighted (gray). (C) Percentage CCR8+ cells within C57BL/6 or OT-II splenic Tregs after 24 hours of in vitro co-culture with TCR stimulants (anti-CD3 +anti-CD28) or Chicken ovalbumin (OVA) (n=3). (D) Percentage CCR8+ cells within C57BL/6 or OT-II LN-derived Tregs after 24 hours of in vitro co-culture with TCR stimulants (anti-CD3+anti-CD28) or Chicken ovalbumin (OVA) (n=3). (E) Percentage CCR8+ cells within C57BL/6 splenic Tregs after 24 hours of in vitro co-culture with TCR stimulants (anti-CD3+anti-CD28) and distinct concentrations of CAPE (n=4). (F) Percentage CCR8+ cells within transferred C57BL/6 or OT-II splenic Tregs 48 hours after intratumoral (i.t.) adoptive transfer into LLC or LLC-OVA tumors (n=3). (C to F) Data shown as mean±SEM. (C, D) ***p<0.001 and ****p<0.0001 by one-way ANOVA where each condition was compared with prior to culture, (E, F) *p<0.05 and **p<0.01 by one-way ANOVA. ANOVA, analysis of variance; LLC, Lewis Lung Carcinoma; UMAP, Uniform Manifold Approximation and Projection.

