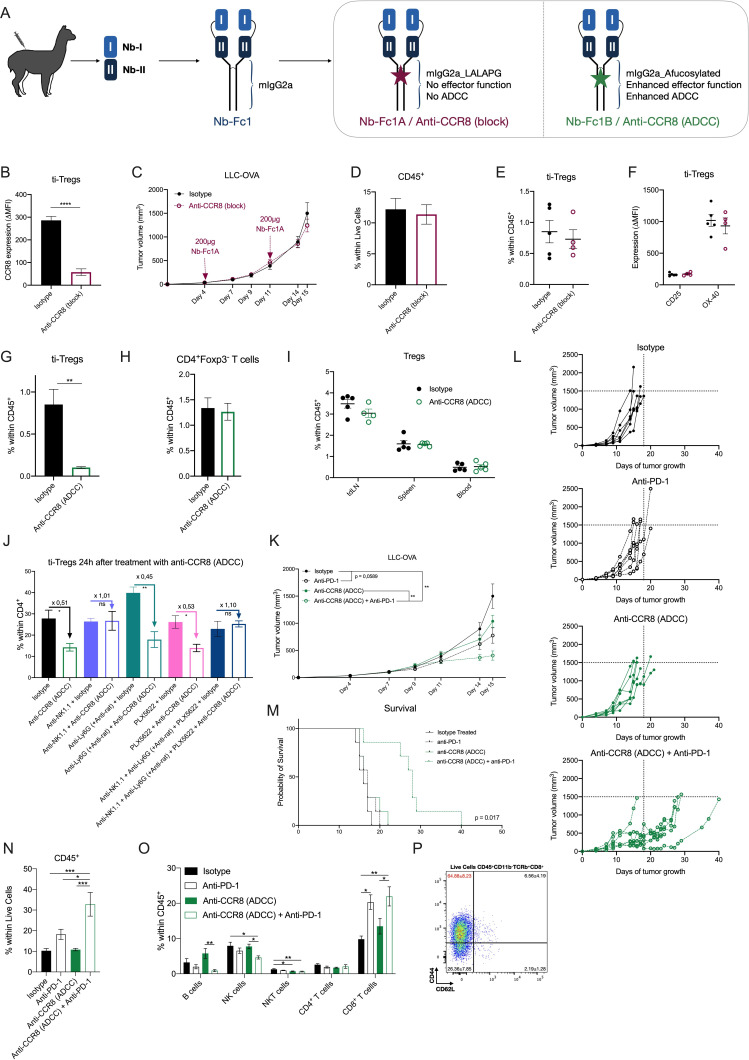
Figure 6.
Specific depletion of CCR8+ ti-Tregs, but not CCR8 blockade, results in reduced LLC-OVA tumor growth and synergizes with anti-PD-1 therapy. (A) Schematic overview of tetravalent Nb-Fc generation. (B) Delta-MFI of CCR8 expression on ti-Tregs of isotype (black) or anti-CCR8 (block) (red) treated mice (n=5). (C) LLC-OVA tumor growth in isotype (black) or anti-CCR8 (block)-treated mice (red) (n=12). (D) Percentage of CD45+ hematopoietic cells within the TME of D16 LLC-OVA tumors of isotype (black) or anti-CCR8 (block)-treated mice (red) (n=5). (E) Percentage of CD4+Foxp3+ Tregs within the CD45+ compartment of D16 LLC-OVA tumors of isotype (black) or anti-CCR8 (block)-treated mice (red) (n=5). (F) Activation marker expression determined via flow cytometry, on ti-Tregs of D16 LLC-OVA tumors of isotype (black) or anti-CCR8 (block)-treated mice (red) (n=5). (G) Percentage of CD4+Foxp3+ Tregs within the CD45+ compartment of D16 LLC-OVA tumors of isotype (black) or anti-CCR8 (ADCC)-treated mice (green) (n=5). (H) Percentage of CD4+Foxp3− T cells within the CD45+ compartment of D16 LLC-OVA tumors of isotype (black) or anti-CCR8 (ADCC)-treated mice (green) (n=5). (I) Percentage of CD4+Foxp3+ Tregs within the CD45+ compartment of distinct organs of isotype (black) or anti-CCR8 (ADCC)-treated (green) LLC-OVA tumor-bearing mice (n=5). (J) Percentage of CD4+Foxp3+ Tregs within the CD4+ compartment of D12 LLC-OVA tumors treated with isotype control or anti-CCR8 (ADCC) in combination with anti-NK1.1, anti-Ly6G (+ anti-rat) and/or PLX5622 (n=4). (K) s.c. LLC-OVA tumor growth in mice treated with isotype (black, closed circle), anti-PD-1 (black, open circle), anti-CCR8 (ADCC) (green, closed circle) or the combination of anti-PD-1 and anti-CCR8 (ADCC) (green, open circle) (n=12). (L) Growth of individual subcutaneous LLC-OVA tumors in mice treated with isotype (black, closed circle), anti-PD-1 (black, open circle), anti-CCR8 (ADCC) (green, closed circle) or the combination of anti-PD-1 and anti-CCR8 (ADCC) (green, open circle) (n=7). (M) Survival (tumor volume <1500 mm3) of LLC-OVA tumor-bearing mice treated with isotype (black, solid line), anti-PD-1 (black, dotted line), anti-CCR8 (ADCC) (green, solid line) or the combination of anti-PD-1 and anti-CCR8 (ADCC) (green, dotted line) (n=7). (N) Percentage of CD45+ hematopoietic cells within the TME of LLC-OVA tumors grown in mice treated with isotype, anti-PD-1, anti-CCR8 (ADCC) or the combination of anti-PD-1 and anti-CCR8 (ADCC) (n=5). (O) Percentage of distinct lymphocyte populations within the CD45+ compartment of LLC-OVA tumors grown in mice treated with isotype, anti-PD-1, anti-CCR8 (ADCC) or the combination of anti-PD-1 and anti-CCR8 (ADCC) (n=5). (P) Representative FACS plot showing the expression level of CD44 and CD62L on the CD8+ T cells within the TME of mice treated with a combination of anti-PD-1 and anti-CCR8 (ADCC) (n=5). (B to K, N to P) Data shown as mean±SEM. (B, D to J) *p<0.05, **p<0.01 and ****p<0.0001 by unpaired Student’s t-test, (C. K) **p<0.01 by two-way ANOVA with Holm-Sidak multiple comparisons test, (N, O) *p<0.05, **p<0.01 and ***p<0.001 by one-way ANOVA. ADCC, antibody-dependent cell-mediated cytotoxicity; anti-PD-1, anti-programmed cell death protein-1; ANOVA, analysis of variance; LLC, Lewis Lung Carcinoma; MFI, median fluorescence intensity; NK, natural killer; s.c., subcutaneously; ti-Treg, tumor-infiltrating regulatory T cell.

