FIGURE 2.
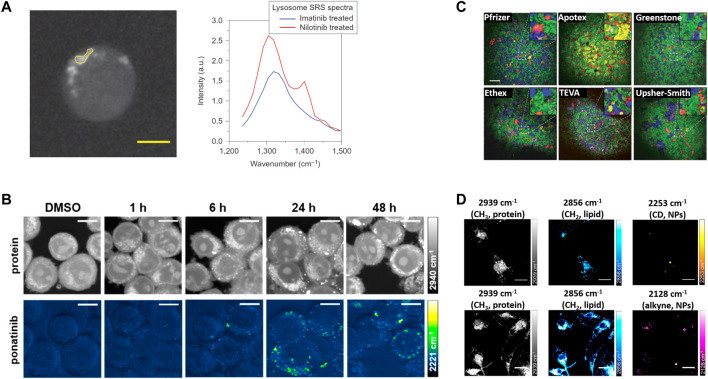
The representative applications of coherent Raman scattering (CRS) microscopy in oncology pharmacokinetics. (A) Representative SRS images at 1305 cm−1 of BaF3/BCR-ABL1 cells treated with 20 mM nilotinib for 4 h. SRS spectra of selected ROI in the left image (yellow polygon). Reprinted with permission from Ref. (Fu et al., 2014). Copyright 2014 Nature Publishing Group. (B) SRS imaging of ponatinib uptake in KCL22Pon−Res cells. KCL22Pon−Res cells were treated with DMSO (0.0003%, v/v) or ponatinib (500 nM) for 1, 6, 24, or 48 h. SRS images acquired at 2940 cm−1 (CH3, proteins), 2221 cm−1 (C≡C, ponatinib), Scale bars: 10 μm. Reprinted with permission from Ref. (Sepp et al., 2020). Copyright 2019 American Chemical Society. (C) Large area SRS imaging of tablets. Green, blue, red, yellow/orange, and magenta colors represent microcrystalline cellulose, dibasic calcium phosphate anhydrous, Amlodipine besylate (API), sodium starch glycolate, and magnesium stearate, respectively. In case of tablet from Apotex the yellow color corresponds to lactose monohydrate and corn starch. Inserts are four times magnified areas of the images indicated by dashed squares. Scale bar: 200 μm. Reprinted with permission from Ref. (Slipchenko et al., 2010). Copyright 2021 Royal Society of Chemistry (D) SRS imaging of nanoparticles (NPs) in microglia. Microglia were incubated with PLGA-CD NPs or PLGA-alkyne NPs. Scale bars: 20 μm. Reprinted with permission from Ref. (Vanden-Hehir et al., 2019a). Copyright © 2019 American Chemical Society.

