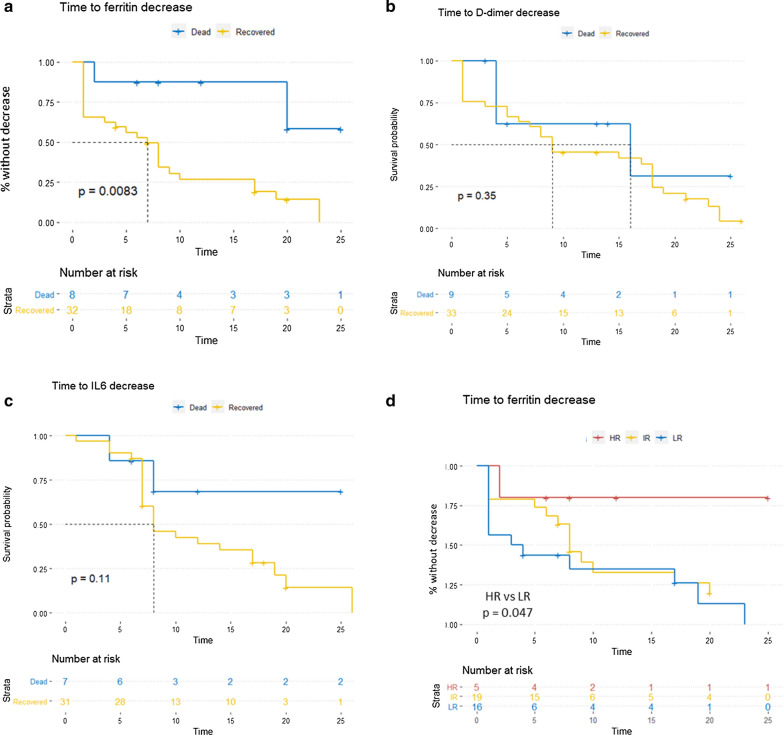
Fig. 2.
Patients with a worse outcome present a significantly longer time to ferritin decrease. a–c Kaplan Meier curves reporting the time to ferritin, D-dimer and IL-6 decrease (intended as the time from hospital admission to first and stable decrease during hospitalization) respectively, stratified on dead/recovered status (p value calculated through LogRank test). d Kaplan Meier curves reporting the time to ferritin decrease stratified on risk groups (p value calculated through LogRank test comparing High-Risk vs. Low-Risk patients)

