Fig. 3.
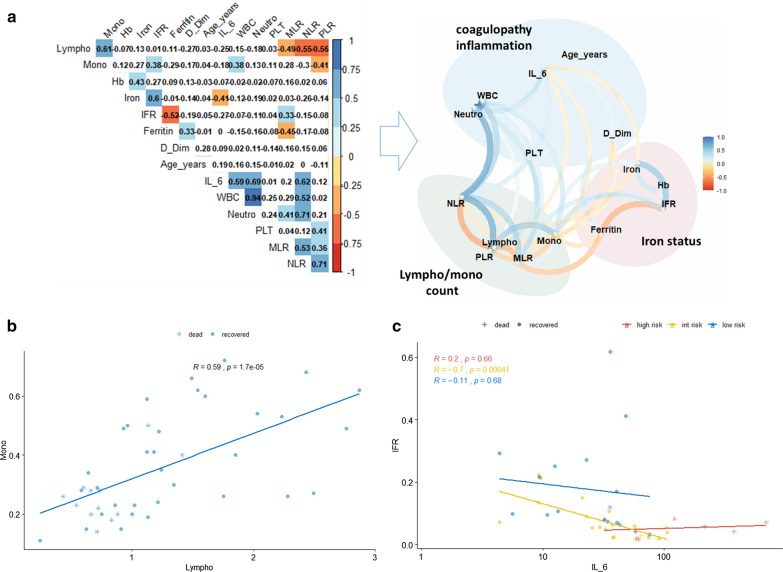
Correlations among lymph/monocytes count, D-dimer, and iron status affect the systemic response to SARS-CoV-2 infection. a Left: correlation plot of all variables [including derivative variables such as iron to ferritin ratio (IFR), neutrophils to lymphocytes ratio (NLR), platelets to lymphocytes ratio (PLR), monocytes to lymphocytes ratio (MLR)] to identify potential inter-variables correlations. The colour represents the direction of the correlation. Only boxes showing a significant correlation have been coloured; right, network plot showing direction and distribution of correlations between variables. Clusters of variables belonging to similar functions have been grouped. b Scatter plot representing the correlation between lymphocytes and monocytes. Remarkably, almost all the deaths are localized within the lower left quadrant of the plot. c Scatter plot showing the association between IL-6 and IFR. This correlation reaches statistical significance within the intermediate group only, further supporting the discriminating role of IFR within this subgroup

