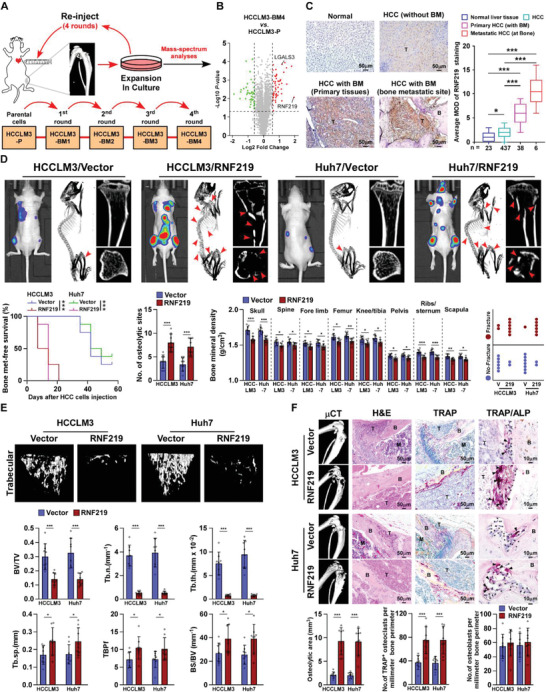
Figure 1.

RNF219 overexpression promotes bone metastasis and SREs in HCC. A) Schematic representation of the establishment of a highly bone‐metastasis HCCLM3‐BM4 cell line. Tumor cells were isolated from bone lesions in mice injected intracardially with HCCLM3‐P/luc cells and cultured, and re‐injected intracardially into mice. This procedure was repeated for four cycles. B) Volcano plot analysis of dysregulated proteins comparing HCCLM3‐BM4 cells with HCCLM3‐P cells. C) Representative images (left) and quantification (right) of RNF219 expression in normal liver tissue (n = 23), HCC tissues without bone‐metastasis (n = 437), primary HCC tissues with bone‐metastasis (n = 38), and HCC bone‐metastasis tissues (n = 6) (left panel). Scale bar, 50 µm. D) Upper: BLI (left) and µCT images (middle and right) of bone lesions from representative mice. Arrowheads: fractured bone site. Lower: Kaplan–Meier bone metastasis‐free survival curve and quantification of the osteolytic sites, BMD and fracture frequency from representative mice (n = 8/group). E) µCT images of trabecular section (upper) and quantification (lower) of bone parameters from representative mice (n = 8/group). BV/TV, bone/tissue volume ratio; BS/TV, bone surface/ tissue volume ratio; Tb. n, trabecular number; Tb. sp., trabecular separation; Tb. th., trabecular thickness; TBPf, trabecular bone pattern factor. F) µCT and histological (H&E, TRAP and TRAP/ALP) images (upper) and quantification (lower) of osteolytic area and TRAP+‐osteoclasts/ALP+‐osteoblasts along the bone‐tumor interface of metastases from representative mice (n = 8/group). Scale bar, 50 µm. Each error bar in panels (C−F) represents the mean ± SD of three independent experiments. Significant differences were determined by one‐way ANOVA with Tukey's multiple comparison test (C–F). * p < 0.05, ** p < 0.01, *** p < 0.001.
