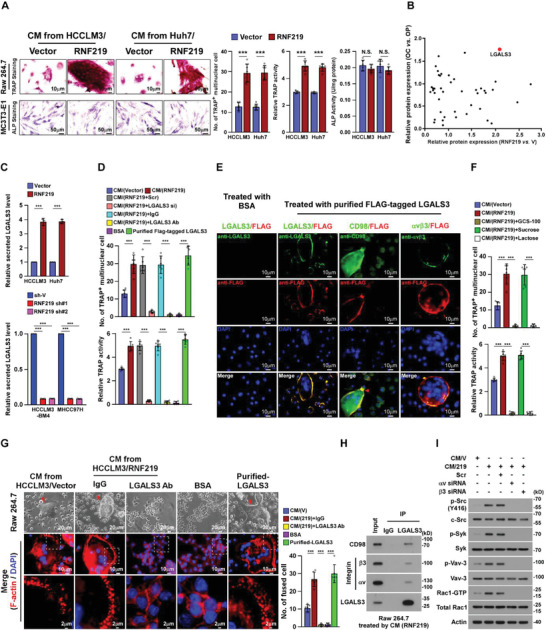
Figure 2.

RNF219 induced‐LGALS3 promotes osteoclastogenesis in vitro. A) Left: Osteoclast differentiation assays by TRAP staining (upper) or osteoblast differentiation assay by ALP staining (lower) in the presence of CM from indicated cells. Right: Quantification of the number of TRAP+‐multinuclear osteoclasts, TRAP activity and ALP activity from the experiment in the left panel. B) Scatter diagram generated from dysregulated proteins in CM‐HCCLM3/vector compared with CM‐HCCLM3/RNF219 and in osteoclast (OC) compared with osteoclast precursor (OP). A full list is available in Table S7, Supporting Information. C) ELISA analysis of secreted LGALS3 protein expression in CM from indicated cells. D) Osteoclast differentiation assays in the presence of the indicated CM, or BSA, or purified LGALS3 from CM‐HCCLM3/Flag‐tagged LGALS3 cells. E) Osteoclast precursor Raw 264.7 cells were treated with BSA, or purified LGALS3 from CM‐HCCLM3/flag‐tagged LGALS3 cells, and then IF staining of LGALS3, Flag‐LGALS3, CD98 and integrin αvβ3. Scale bar, 10 µm. F) Quantification of the osteoclast differentiation in the presence of the CM‐HCCLM3/Vector, or CM‐HCCLM3/RNF219, or CM‐HCCLM3 plus GCS‐100, or CM‐HCCLM3 plus sucrose, or CM‐HCCLM3 plus lactose. G) Left: Phase contrast micrograph of RAW 264.7 cells as indicated treatments (upper) and IF staining images of phalloidin (F‐actin) (middle and lower). Scale Bar, 20 µm (upper), 10 µm (middle) and 2 µm (lower). Right: Quantification of the number of fused multinuclear cells from the experiment in the left panel. H) Co‐IP assays using anti‐LGALS3 or anti‐IgG antibodies in CM‐HCCLM3/RNF219‐treated RAW264.7 cells and WB analysis of expression of CD98, integrin αv, integrin β3, and LGALS3. I) WB analysis of phosphorylation level of SRC, SYK, and VAV‐3 and expression of RAC‐GTP in Raw 264.7 cells as indicated treatments. β‐actin served as the loading control. Each error bar in panels A, C, D, F, and G represents the mean ± SD of three independent experiments. Significant differences were determined by one‐way ANOVA with Tukey's multiple comparison test (A, C, D, F, and G). ** p < 0.01, *** p < 0.001 and N.S.: not significant (p > 0.05).
