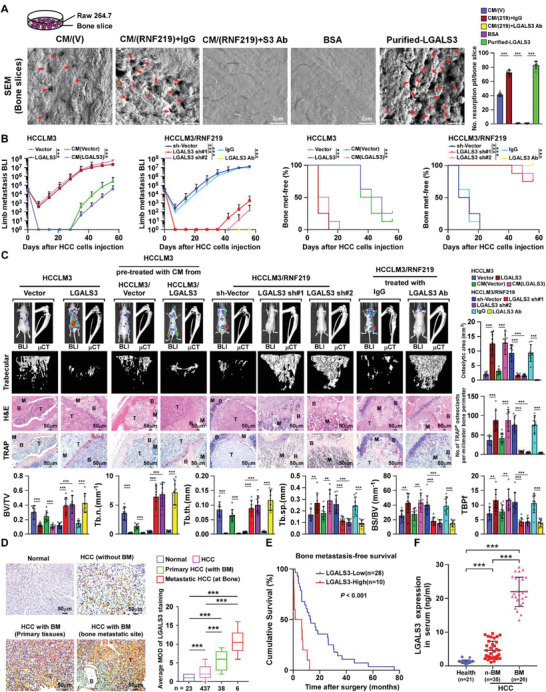
Figure 3.

LGALS3 promotes osteolytic bone metastasis of HCC. A) Bone resorption assays of RAW 264.7 cells cultured onto the bone slices for indicated treatments. Then bone slice was fixed for scanning electron microscopy (SEM) (left) and quantification of the number of resorption pit per bone slice (right). B) Normalized BLI signals of bone metastases and Kaplan–Meier bone metastasis‐free survival curve of mice from the indicated experimental group (n = 8/group). C) Upper left: BLI, μCT (longitudinal and trabecular section), and histological (H&E and TRAP staining) images of bone lesions from representative mice. Scale bar, 50 µm. Upper right and lower: Quantification of the μCT osteolytic lesion area and TRAP+ osteoclasts along the bone‐tumor interface of metastases (upper right) and bone parameters (lower) from the experiment in the upper left panel. D) Representative images (left) and quantification (right) of LGALS3 expression in normal liver tissue (n = 23), HCC tissues without bone metastasis (n = 437), primary HCC tissues with bone metastasis (n = 38), and HCC tissues in bone metastatic site (n = 6) (left panel). Scale bar, 50 µm. E) Kaplan–Meier analysis of bone metastasis‐free survival curves in HCC‐BM with low versus high expression of LGALS3 (n = 38; p < 0.001, log‐rank test). F) ELISA analysis of serum LGALS3 expression from healthy donors (n = 21), HCC patients without bone metastasis (n‐BM, n = 35), HCC patients with bone metastasis (BM, n = 26). Each error bar in panels (A–D) and (F) represents the mean ± SD of three independent experiments. Significant differences were determined by one‐way ANOVA with Tukey's multiple comparison test (A–D, F). ** p < 0.01, *** p < 0.001.
