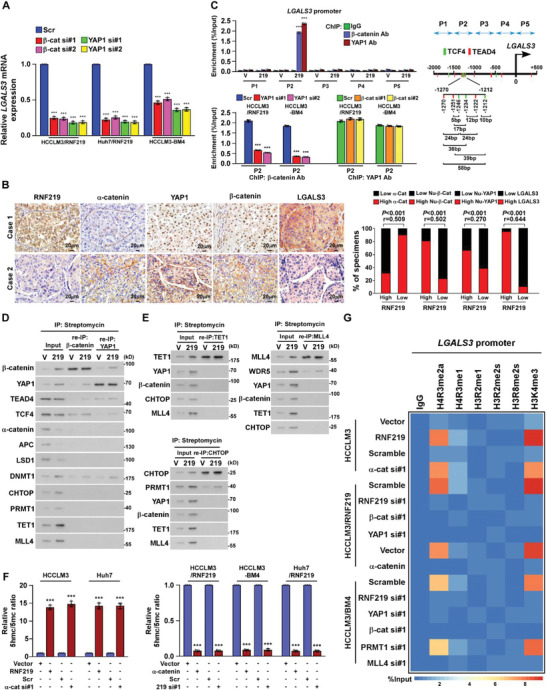
Figure 6.

RNF219 induced spatial epigenetic modifications of the LGALS3 promoter. A) Real‐time PCR analysis of mRNA level of LGALS3 in the indicated cells. GAPDH serve as a loading control. B) RNF219 levels were negatively associated with α‐catenin and positively related to nuclear β‐catenin, YAP1, or LGALS3 expression in 475 human HCC specimens. Left: Two representative specimens are shown. Scale bars, 20 µm. Right: Percentages of specimens showing low or high RNF219 expression relative to the levels of α‐catenin, nuclear β‐catenin, nuclear YAP1, or LGALS3. C) Left: ChIP assay analyses of enrichment of β‐catenin and YAP1 on the LGALS3 promoter in the indicated cells. Right: Schematic illustration of TCF4 and TEAD4 binding site at LGALS3 promoter. D) Re‐co‐IP assay, using CAPTURE‐approached proteins, analyses of interaction of β‐catenin or YAP1 with the indicated trans‐regulatory factors, identified in experiment in Figure 4A, in vector‐ or RNF219‐transduced HCCLM3 cells. E) Re‐co‐IP assay, using CAPTURE‐approached proteins, analyses of interaction of TET1 (left upper), or CHTOP 9 (left lower), or MLL4 (right upper) with the indicated trans‐regulatory factors on the LGALS3 promoter in the vector‐ or RNF219‐transduced HCCLM3 cells. F) Relative 5hmc/5mc ratio was examined in the indicated cells. G) Heatmap represented by pseudocolors was generated using the ChIP‐qPCR values that represented the enrichment of H4R3me2a, H4R3me1, H2AR11me1, H3R2me1, H3R2me2s, H3R8me2s, and H3K4me3 on the LGALS3 promoter in the indicated cells. Each error bar in panels (A,C,F) represents the mean ± SD of three independent experiments. Significant differences were determined by one‐way ANOVA with Tukey's multiple comparison test (A,C,F). *** p < 0.001.
