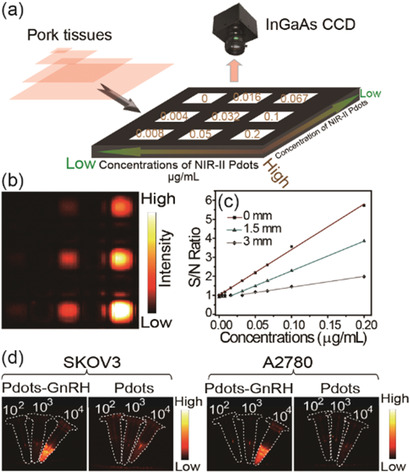
Figure 2.

a) Simplified diagram depicting the experimental setup of the in vitro experiment, the average signal‐to‐noise ratio of every well were collected under different concentrations and different thickness of pork tissue. b) NIR‐II fluorescence image of different concentrations (0–0.2 µg mL−1) of NIR‐II Pdots without cover of pork tissue. c) Corresponding plots of the S/N ratio value as a function of the concentrations of NIR‐II Pdots under the cover of different thickness (0–3 mm) of pork tissue. d) NIR‐II fluorescent images of NIR‐II Pdots and NIR‐II Pdots‐GnRH labeled ovarian cancer cells (SKOV3 and A2780) at different concentrations. Excitation: 730 nm; collected signal: 1100LP, 200 ms.
