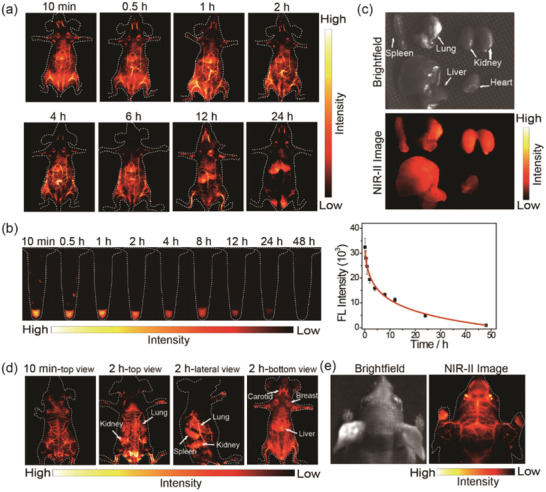
Figure 3.

a) Time course of NIR‐II fluorescence images of living mice injected with 200 µL (1 mg mL−1) NIR‐II Pdots. Images were acquired at 10 min, 0.5, 1, 2, 4, 6, 12, and 24 h pi, respectively. b) Fluorescence images of blood samples at different time point and the corresponding time course of fluorescence intensity during in 48 h. c) Biodistribution of main organs of NIR‐II Pdots‐treated mice after 48 h postinjection. d) In vivo fluorescence imaging of whole‐body at different imaging view. e) NIR‐II fluorescence images of brain vessels in head (right) and the corresponding brightfield images (left).
