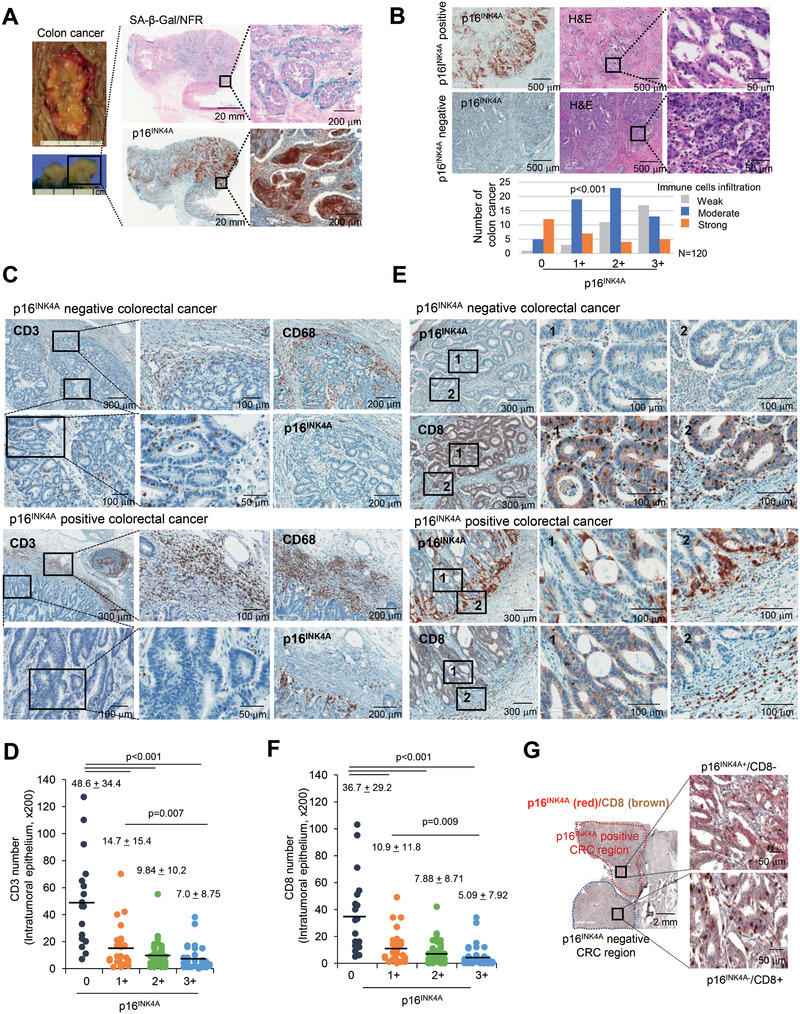
Figure 1.

Senescent tumor cells are frequently identified in CRC. A) Fresh CRC tissues were divided into two identical tissue sections and processed for either fresh frozen section for SA‐β‐Gal staining or as FFPE section for p16INK4A immunostaining. Nuclear fast red (NFR) for SA‐β‐Gal staining was applied as counterstain. The upper left panel shows the gross appearance of CRC, and the lower left panel shows the cross section of the CRC. The upper and lower right panels show the results of SA‐β‐Gal/NFR and p16INK4A immunostaining, respectively. B) χ 2 analysis of immune cell infiltration according to grades of p16INK4A immunostaining in 120 cases of MSS CRC tissues. C) CD3 positive cells infiltrated into p16INK4A negative CRC. p16INK4A negative and positive CRC tissues were serially dissected and immunostained for CD3, p16INK4A and CD68. D) Infiltrated CD3+ T cell numbers were analyzed according to the grades of p16INK4A (200× field). E) CD8 and p16INK4A immunostaining in CRC. “1” and “2” indicate the high magnification views of the original figure. F) Infiltrated CD8+ T cell numbers were analyzed according to the grades of p16INK4A (200× field). G) CRC tissues were stained with p16INK4A and CD8. The upper p16INK4A positive area and the lower p16INK4A negative area of the cancer showed different patterns of CD8+ T cell infiltration. p16INK4A negative and positive CRC indicates grade 0 and 1+, 2+, and 3+, respectively. The p value (D, F) was calculated by one‐way ANOVA and post hoc analysis. Results are presented as mean ± SD.
