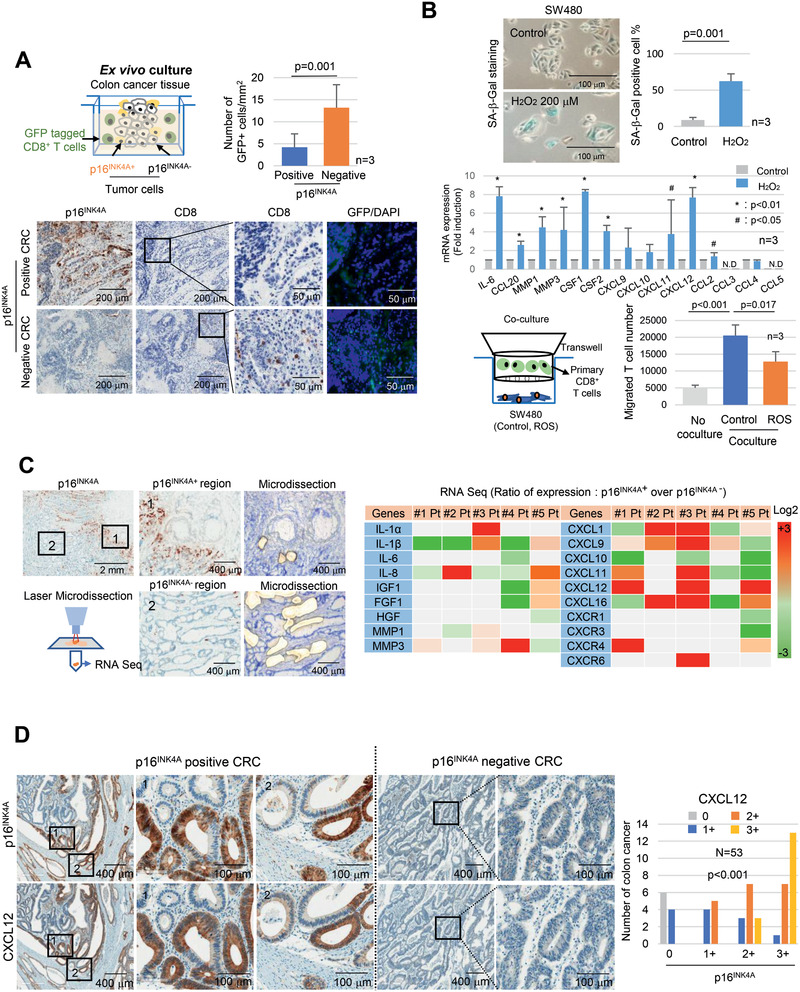
Figure 2.

Senescent tumor cells exclude CD8+ T cells. A) Ex vivo culture. p16INK4A positive or negative CRC tissues were cocultured with the GFP lentivirus infected isolated primary CD8+ T cells for 24 h and then stained with p16INK4A, CD8, and GFP. The number of GFP positive cells was counted and presented as a bar graph. B) Senescent tumor cells inhibited CD8+ T cell migration. SW480 cells were treated with H2O2 (200 × 10−6 m) for 3 days and analyzed for SA‐β‐Gal expression (upper panel) and SASP expression (middle panel). T cell migration assay. Isolated primary CD8+ T cells were cocultured with SW480 (control or H2O2 treated) for 3 h, and the number of migrated CD8+ T cells was counted. C) Microdissection analysis. CRC tissues were serially dissected and stained with p16INK4A and toluidine blue. p16INK4A positive and negative regions were microdissected and then analyzed for mRNA expression (N = 5, upper panel). The expression in RNA sequencing indicates the relative values of the p16INK4A positive region compared with those of the p16INK4A negative region. D) CXCL12 expression in p16INK4A expressing senescent tumor cells. p16INK4A positive and negative CRC tissues were serially dissected and stained with p16INK4A and CXCL12 antibody, respectively. “1” and “2” indicate the high magnification views of the original figure. Results are presented as mean ± SD. The p value was calculated by the Mann–Whitney U test A) or Kruskall–Wallis test B) or χ 2 test D). N and n indicated the number of cases and independent experiments, respectively.
