Figure 1.

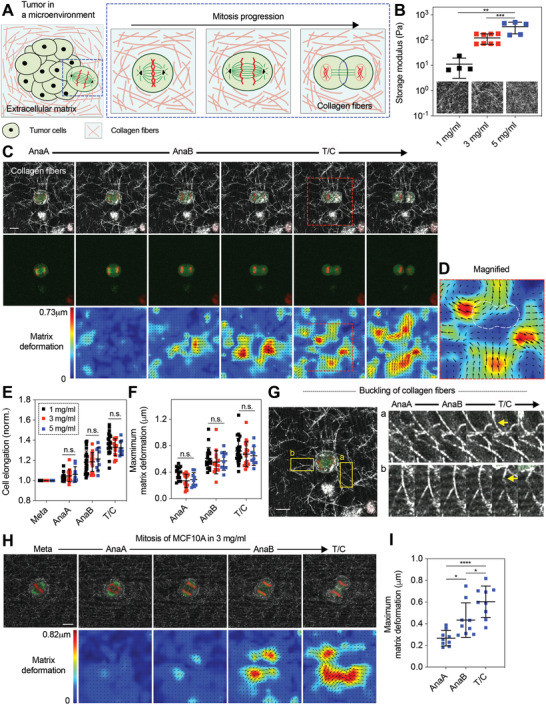
Cells dividing in collagen gels generate extracellular pushing forces along the mitotic axis that deform the surrounding collagen fibers from anaphase to telophase/cytokinesis. A) Schematic of a cell dividing in a collagen‐rich stromal microenvironment. B) Shear storage moduli of collagen gels at the indicated densities. Inset, reflectance images of collagen networks with varying density. C) Fluorescence images of a dividing cell along with reflectance images of collagen fibers (top row), the dividing cell alone (middle row), and corresponding matrix displacement maps (bottom row) overlaid with displacement vectors (black). 1 mg mL−1 collagen gels were used. See Video S1 in the Supporting Information. Red dotted box indicates region of interest to be magnified in (D). Here and in all other figures, red and green indicate histones labeled with red fluorescent protein (RFP) and microtubules labeled with green fluorescent protein (GFP), respectively. D) Magnified image of the region indicated in (C). E) Quantification of cell elongation in collagen gels of varying density at each mitotic stage (n = 9–22, N > 3). The length of cell body was normalized by the initial length. F) Assessment of maximum matrix deformation generated during division in collagen gels of varying density (n = 9–22, N > 3). G) Buckling of collagen fibers were observed along mitotic axis during elongation (yellow arrow), indicating pushing force generation. See Video S2 in the Supporting Information. Out of 31 mitotic cells, 10 cells were found to buckle one or two collagen fibers surrounding the cells during division (≈32%). H) Fluorescence images of a dividing MCF10A cell along with reflectance images of collagen fibers (top row), and corresponding matrix displacement maps (bottom row) overlaid with displacement vectors (black). 3 mg mL−1 collagen gels were used. I) Assessment of maximum matrix deformation generated by MCF10A cells during division in collagen gels (n = 9, N > 3). B,E,F,I) One‐way analysis of variance with Tukey's multiple comparison; n.s. not significant between all groups. * p < 0.05, ** p < 0.01, *** p < 0.001, and **** p < 0.0001. Data are presented as mean ± SD. Scale bars, 10 µm.
