
Figure 3.
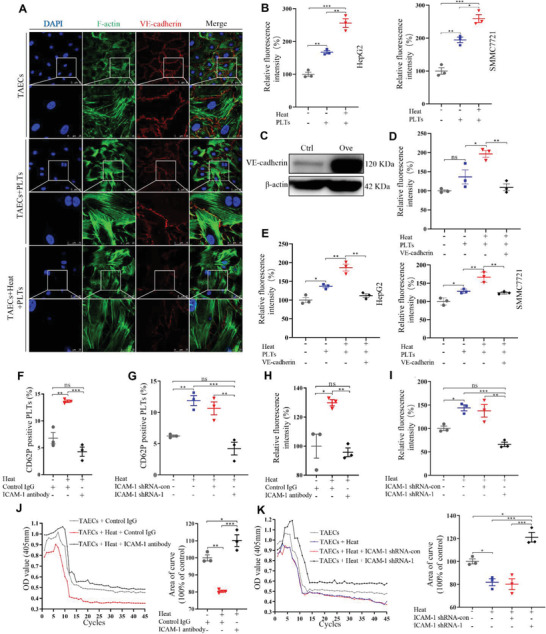
Platelets and heat treatment induce the permeability of endothelial monolayers and facilitate the transendothelial invasion of HCC cells via VE‐cadherin. A) TAEC monolayers are treated with heat and platelets, and VE‐cadherin expressions are examined by laser scanning confocal. Scale bar = 50 µm. B) HepG2 and SMMC7721 cells are used to perform tumor transendothelial assay. The number of HepG2 and SMMC7721 cells invading through the TAEC monolayers is calculated (n = 3, *p < 0.05, **p < 0.01, ***p < 0.001 by one‐way ANOVA). C) VE‐cadherin is overexpressed in TAECs using lentivirus and confirmed by western blotting. D) After VE‐cadherin overexpression in TAECs, TAEC monolayers are treated with heat and platelets, and media containing teletstetramelthyrhodamine‐dextran (250 µg mL−1) are added to the upper chamber. Media from the lower chamber are taken to measure fluorescence intensities at 90 min (n = 3, *p < 0.05, **p < 0.01 by one‐way ANOVA). E) After VE‐cadherin overexpression in TAECs, TAEC monolayers are treated with heat and platelets, and the number of HepG2 and SMMC7721 cells invading through the TAEC monolayers is assessed (n = 3, *p < 0.05, **p < 0.01 by one‐way ANOVA). F,G) Anti‐ICAM‐1 antibody and ICAM‐1 shRNA are used to block ICAM‐1 in TAECs. Cocultured platelets are collected, and CD62P‐positive platelets are measured with flow cytometry (n = 3, **p < 0.01, ***p < 0.001 by one‐way ANOVA). H,I) Platelet adhesion is examined (n = 3, *p < 0.05, **p < 0.01, ***p < 0.001 by one‐way ANOVA). J,K) Platelet aggregation is examined (n = 3, *p < 0.05, **p < 0.01, ***p < 0.001 by one‐way ANOVA). PLTs: platelets. All results are expressed as means ± SEM.