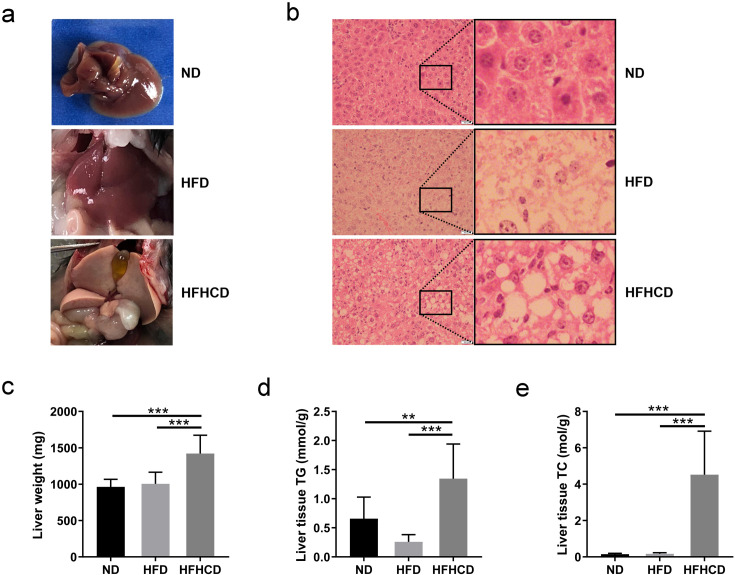
Fig. 2.
Liver parameters of mice at week 12 of feeding (n=6–10 per group). (a) Representative images of livers of mice in the three groups. (b) The H&E staining profiles of liver tissues. Scale bars: 500 µm. (c) Liver weight, (d) liver tissue triglyceride (TG) levels and (e) liver tissue total cholesterol (TC) levels of each group. *P<0.05; **P<0.01; ***P<0.001. ND, normal diet; HFD, high-fat diet; HFHCD, high-fat and high-cholesterol diet.

