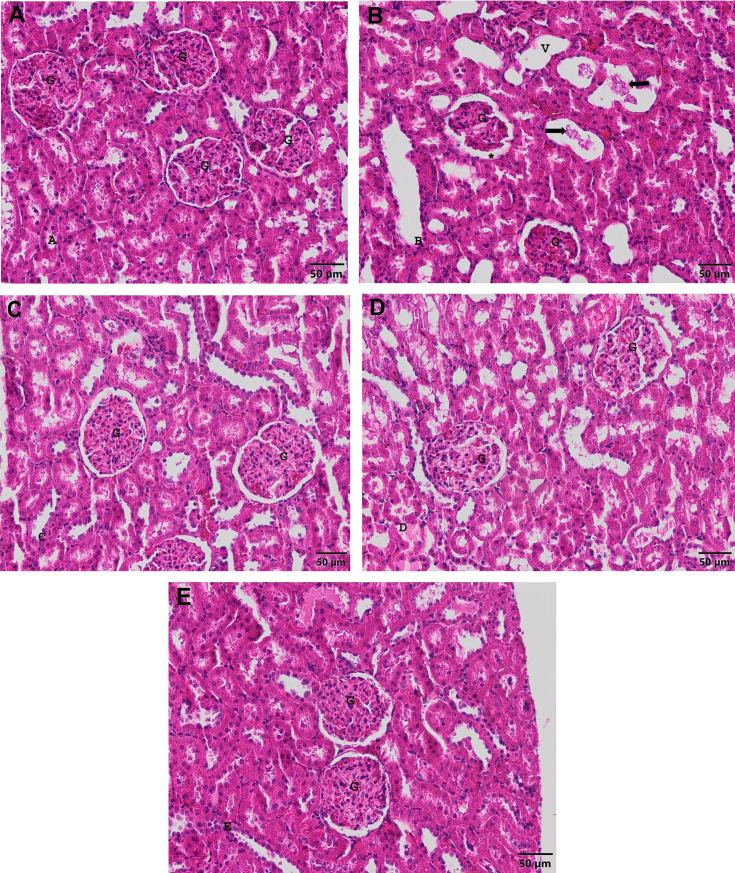
Fig. 2.
Kidney image of experimental groups. G: Glomerulus. A. Control group. Bar: 50 µm. H&E stain. B. APAP group. *: Enlarged Bowman spacing. V: Dilated tubules. Hyaline cast (arrows) Bar: 50 µm. H&E stain. C. FA group. Bar: 50 µm. H&E stain. D. APAP+FA group. Bar: 50 µm. H&E stain. E. APAP+NAC group. Bar: 50 µm. H&E stain.

