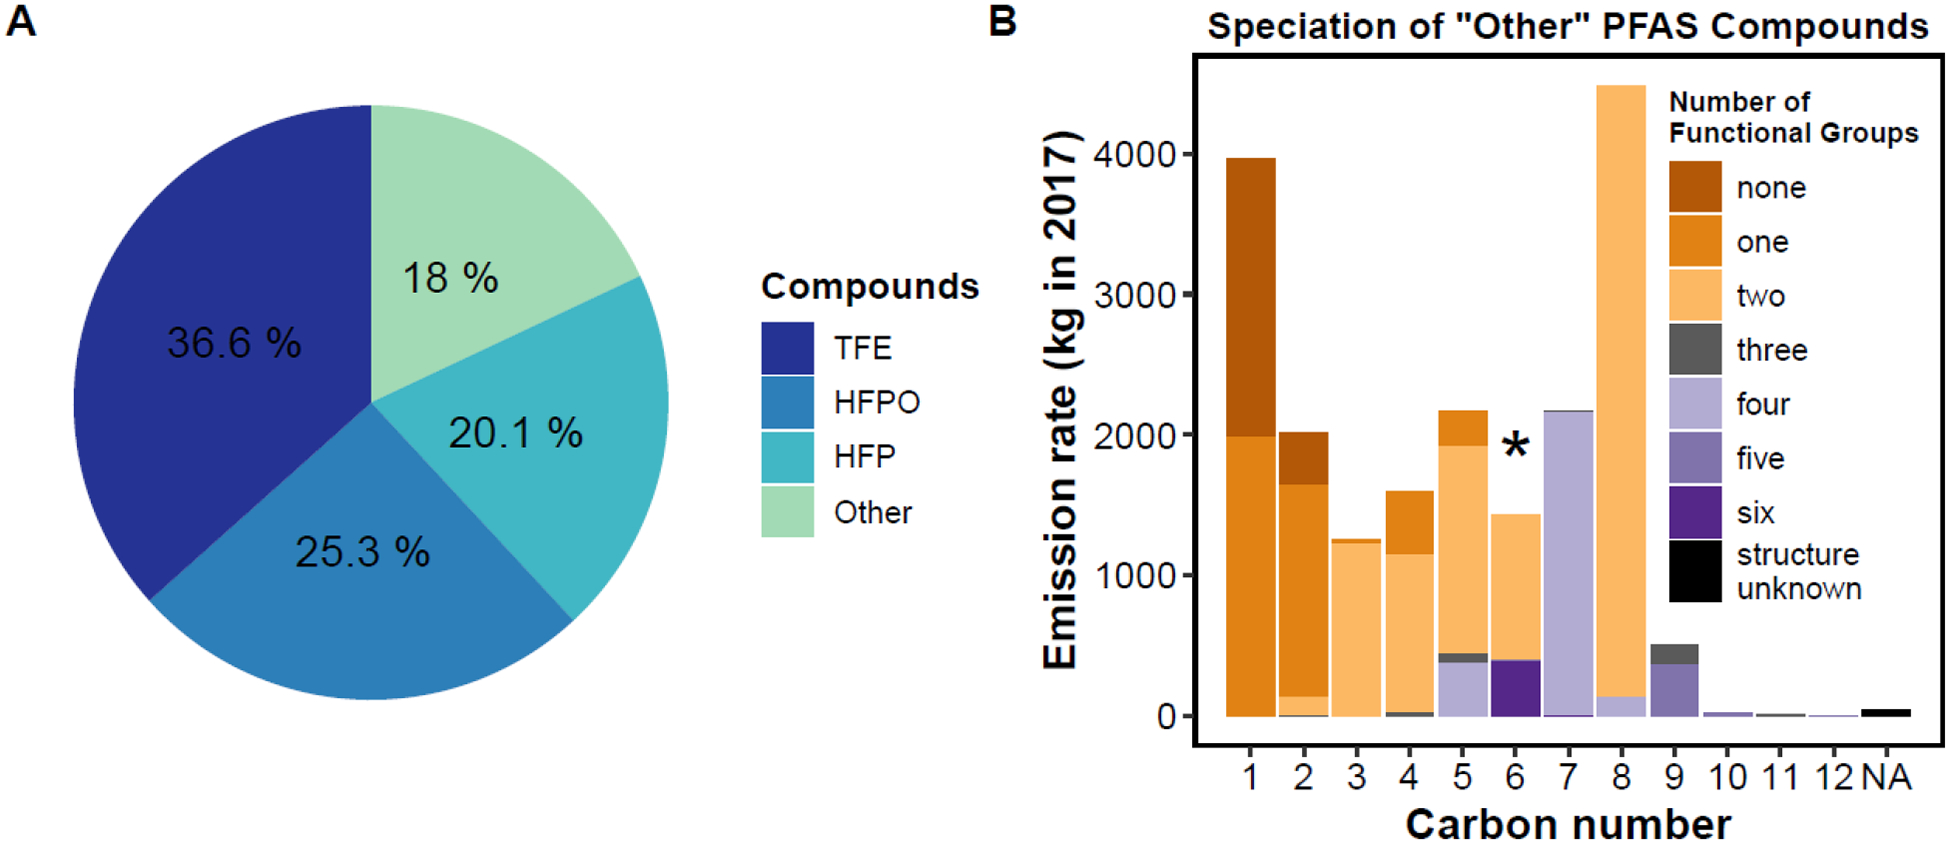
Figure 1.

(A) Pie chart of facility emissions, with the lowest 50 by mass grouped into “other”. (B) Facility emissions for the “other” category by carbon number, categorized by number of functional groups. Compounds with unknown structure are grouped in the “NA” bin. The * indicates the location of total GenX (HFPO-DA + HFPO-DAF, gas + particle).
