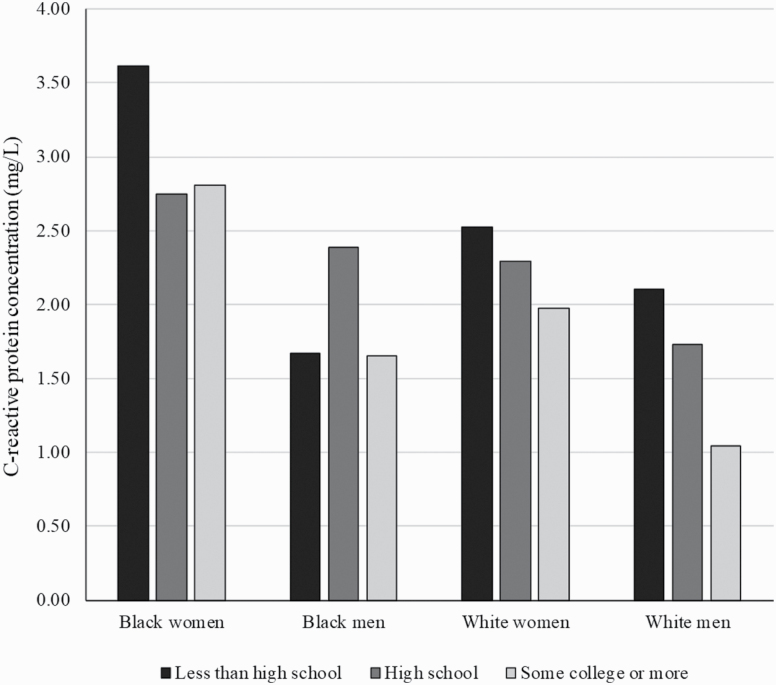
Figure 1.
C-reactive protein (mg/L) by level of educational attainment across race/gender subgroups in the Health and Retirement Study (N = 6,521). Analyses were based on black × woman × education interaction tested in Model 1 of Table 3. Analyses were weighted to adjust for differential selection into the study. Analyses adjusted for age, marital status, income, and wealth.

