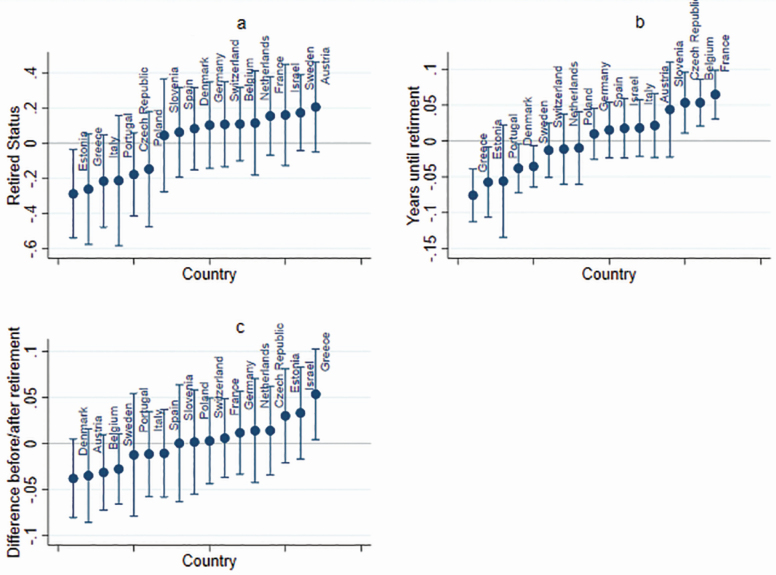
Figure 2.
Caterpillar plots of random-effect residuals with 95% CI. Panel A displays Deviations from the overall average effect of retirement by country of residence; Panel B displays deviations from the overall average preretirement age slope of memory by country of residence; and Panel C displays deviations from the overall average change in the slope before compared to after retirement by country of residence.

