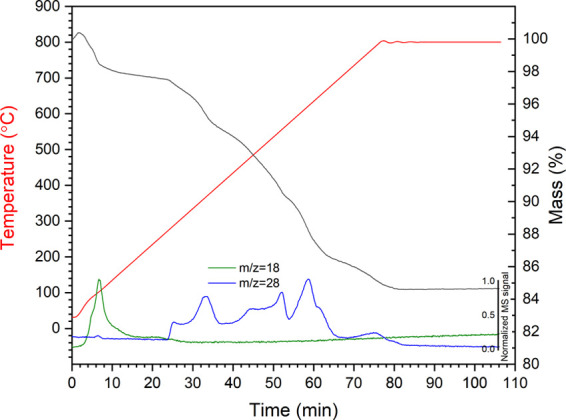
Figure 6.

Thermogravimetry (TG, black) curve and mass spectrometry (MS) signals of 170 °C 24 h amide product (mass numbers 18 and 28 represent H2O and N2, respectively).

Thermogravimetry (TG, black) curve and mass spectrometry (MS) signals of 170 °C 24 h amide product (mass numbers 18 and 28 represent H2O and N2, respectively).