
Figure 1. Mevalonate-derived isoprenoid synthesis is essential for suppressive activity of activated Treg cells.
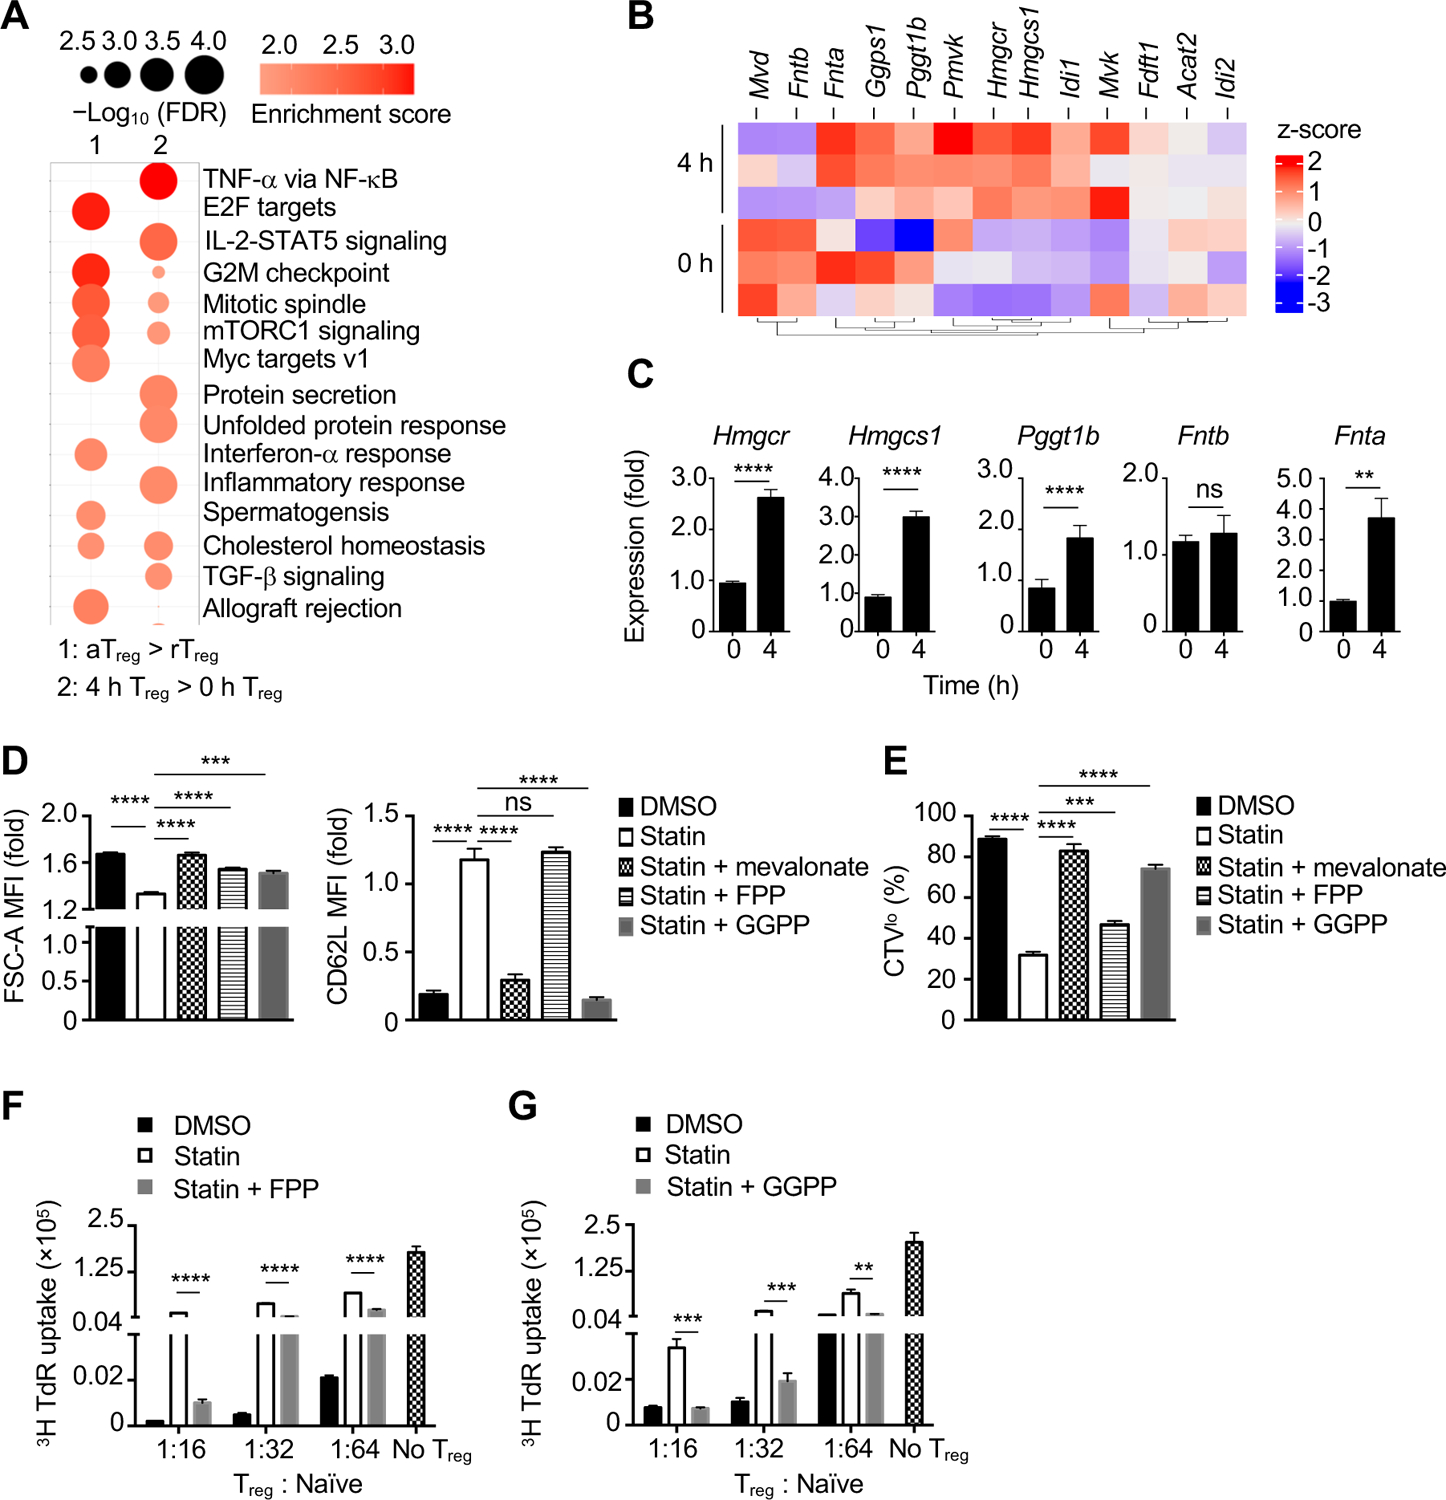
(A) Gene set enrichment analysis (GSEA) of the transcriptome of in vivo activated Treg (aTreg) compared to resting Treg (rTreg) cells (left) (Arvey et al., 2014), or Treg cells stimulated with anti-CD3/28 for 0 or 4 h in vitro (right) (Wakamatsu et al., 2013). (B and C) Heat map (B) and real-time PCR analysis (C) of mevalonate pathway-related genes in Treg cells activated for 0 or 4 h. (D and E) Quantification of cell size (FSC-A) (D), CD62L expression (D) and cell proliferation [Celltrace Violet (CTVlo)] (E) in aTreg cells stimulated with anti-CD3/28 plus IL-2 for 3 days in the presence of DMSO or 2 μM simvastatin (statin) and supplied with indicated metabolites. MFI, mean fluorescence intensity. (F and G) aTreg cells were generated as in (D and E) in the presence of 2 μM statin and supplied with 20 μM FPP or 5 μM GGPP, followed by co-culture with naïve CD4+ T cells and assessment of aTreg-cell suppressive activity.
Data are representative of two (F, G), or compiled from two (Fnta in C, D and E), four (Hmgcr, Hmgcs1, Pggt1b, Fntb in C) independent experiments, with at 4–6 (C) or 6 (D, E) biological replicates or 3 technical replicates (F, G) per group. *p < 0.05, **p < 0.01, ***p < 0.001, ****p < 0.0001, ns, not significant; two-tailed unpaired Student’s t-test (C) or one-way ANOVA (D–G). Data are mean ± s.e.m. Fold change of 0 h (C) or IL-2 treatment (D). See also Figure S1.