
Figure 2. Fntb and Pggt1b in Treg cells are indispensable for immune homeostasis.
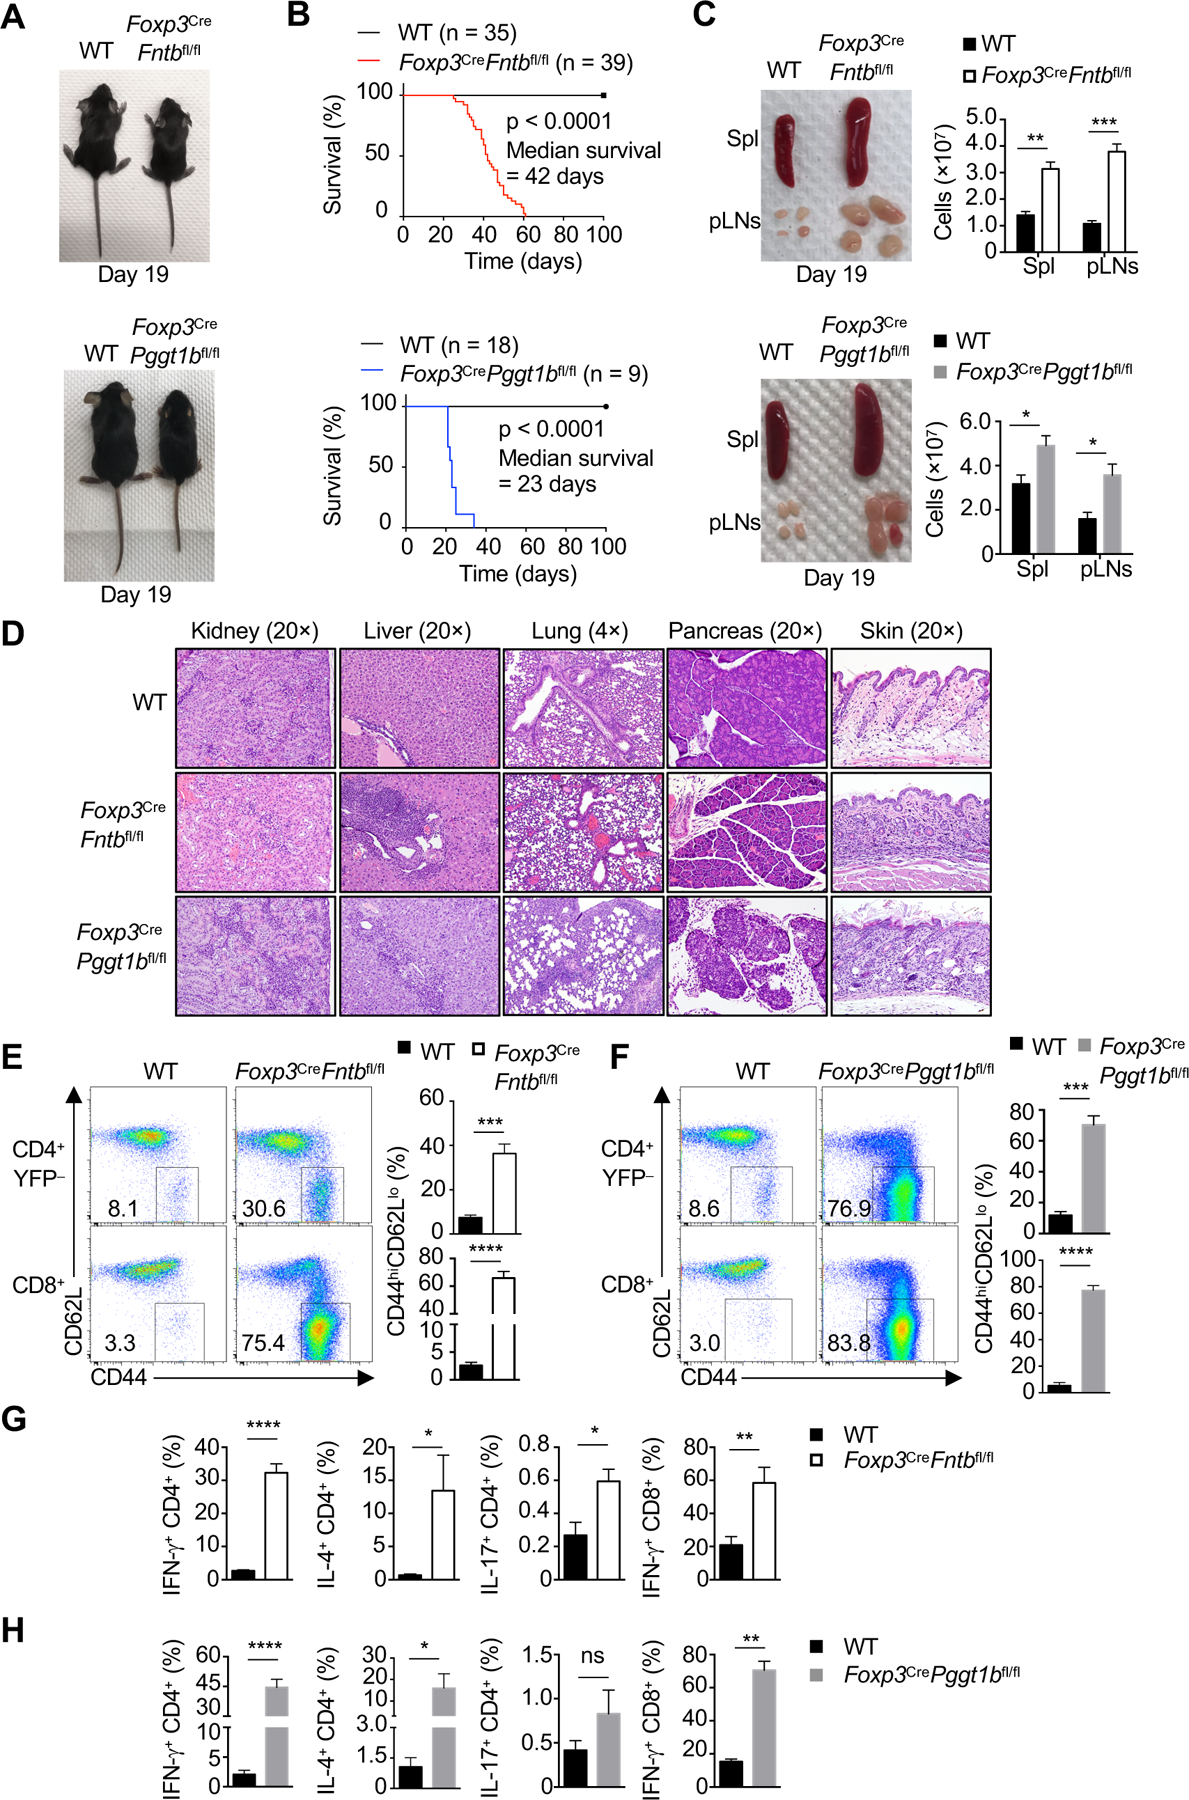
(A) Representative images of 19-day-old Foxp3CreFntbfl/fl mice or Foxp3CrePggt1bfl/fl mice. (B) Survival of Foxp3CreFntbfl/fl or Foxp3CrePggt1bfl/fl mice. (C) Representative images and quantification of cell numbers of enlarged spleen (Spl) and peripheral lymph nodes (pLN) of mutant mice. (D) Representative H&E staining from indicated mice at 3 weeks. (E and F) Flow cytometry analysis of CD44hiCD62Llo CD4+Foxp3-YFP− or CD8+ T cells. Right, frequency of splenic CD44hiCD62Llo CD4+Foxp3-YFP− or CD8+ T cells. (G and H) Frequencies of splenic IFN-γ+, IL-4+, or IL-17+ CD4+ T cells and IFN-γ+ CD8+ T cells.
Data are representative of seven (A, C, E, G) or one (D), or compiled from three (C, lower right; H) or two (F, G) independent experiments, with 3–4 (C, E–H) mice per group. *p < 0.05, **p < 0.01, ***p < 0.001, ****p < 0.0001, ns, not significant; two-tailed unpaired Student’s t-test (C, E– H). Data are mean ± s.e.m. Numbers indicate percentage of cells in gates. See also Figure S2.