
Figure 4. Fntb and Pggt1b orchestrate discrete transcriptional programming of eTreg cells.
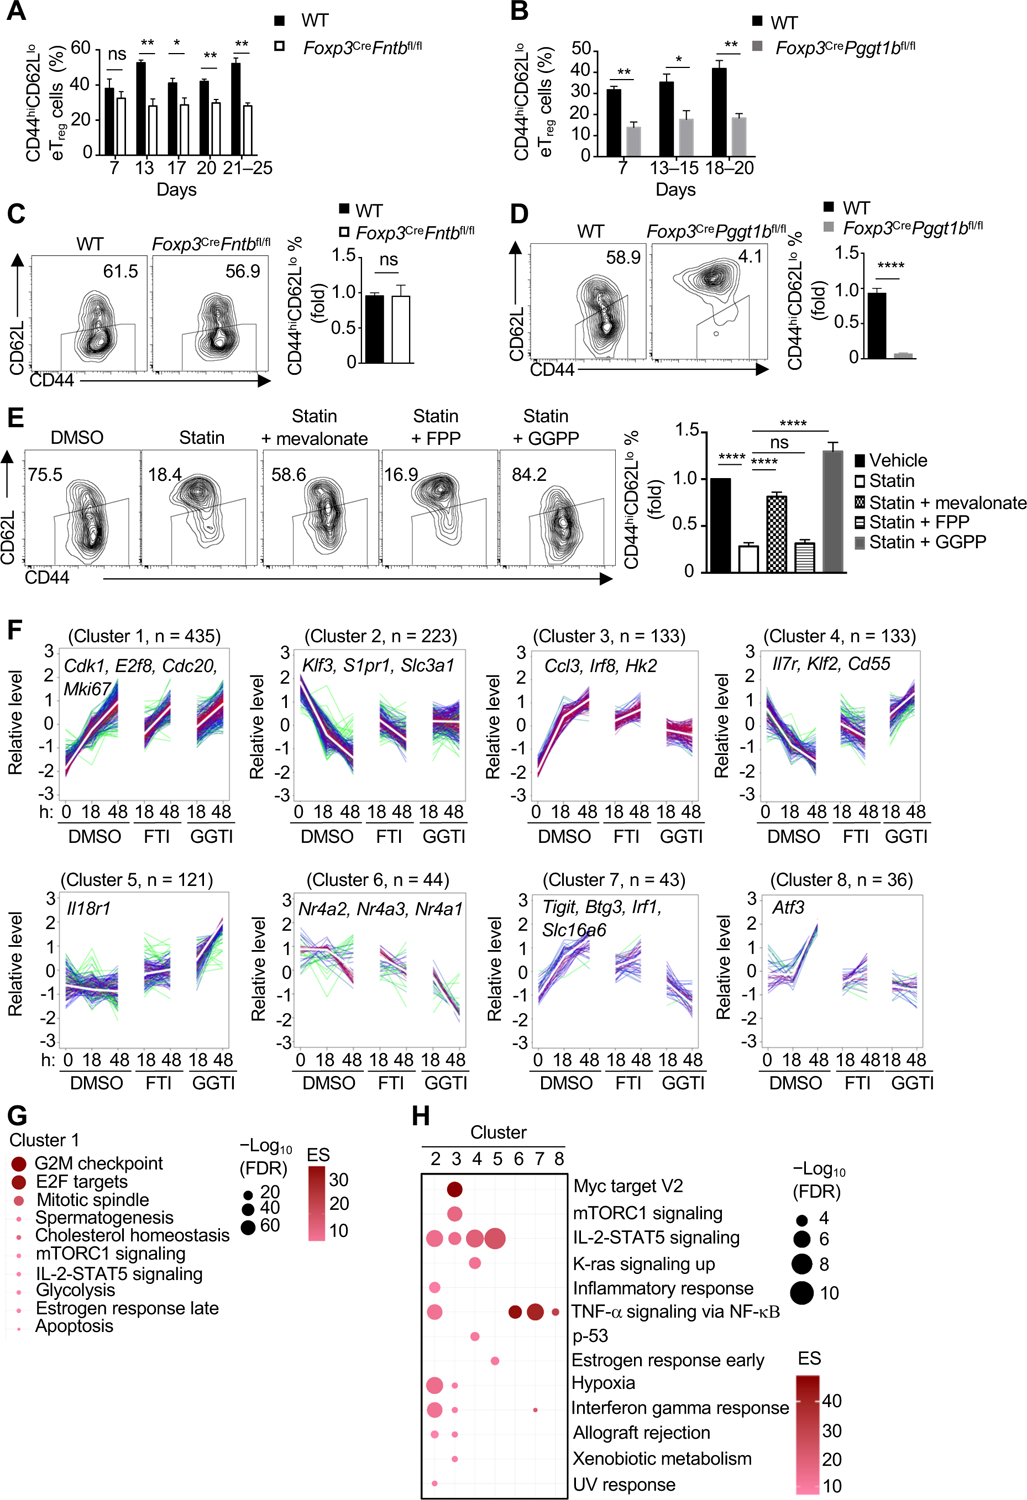
(A and B) Quantification of CD44hiCD62Llo eTreg-cell percentage in peripheral lymph nodes at the indicated ages. (C and D) Flow cytometry and quantification of eTreg-like cells generated from cTreg cells isolated from the indicated mice. (E) cTreg cells were activated with anti-CD3/28 plus IL-2 for 3 days in the presence of DMSO or simvastatin (statin) with or without mevalonate, FPP or GGPP. Flow cytometry analysis and quantification of eTreg-like cell generation. (F) Weighted gene correlation network analysis (WGCNA) of cTreg cells activated with anti-CD3/28 plus IL-2 for the indicated times in the presence of DMSO, FTI, or GGTI. The number of genes in each cluster, and representative gene names, are indicated. (G and H) Functional enrichment of hallmark pathways in cluster 1 (G) or clusters 2–8 (H) from WGCNA.
Data are compiled from three (A for day 7 and days 21–25, B for day 7 and days 13–15, D), two (A for day 17, B for days 18–20, E), one (A for day 13 and day 20) or five (C) independent experiments, with at least 3–5 (A), 3–6 (B), 5 (C), 4 (D) or 6 (E) biological replicates per group. *p < 0.05, **p < 0.01, ****p < 0.0001, ns, not significant; two-tailed unpaired Student’s t-test (A–D) or one-way ANOVA (E). Data are mean ± s.e.m. Controls were normalized to 1 for each comparison (black bars) (C–E). See also Figure S4.