
Figure 5. Fntb promotes the maintenance of eTreg cells by mTORC1 and ICOS signaling.
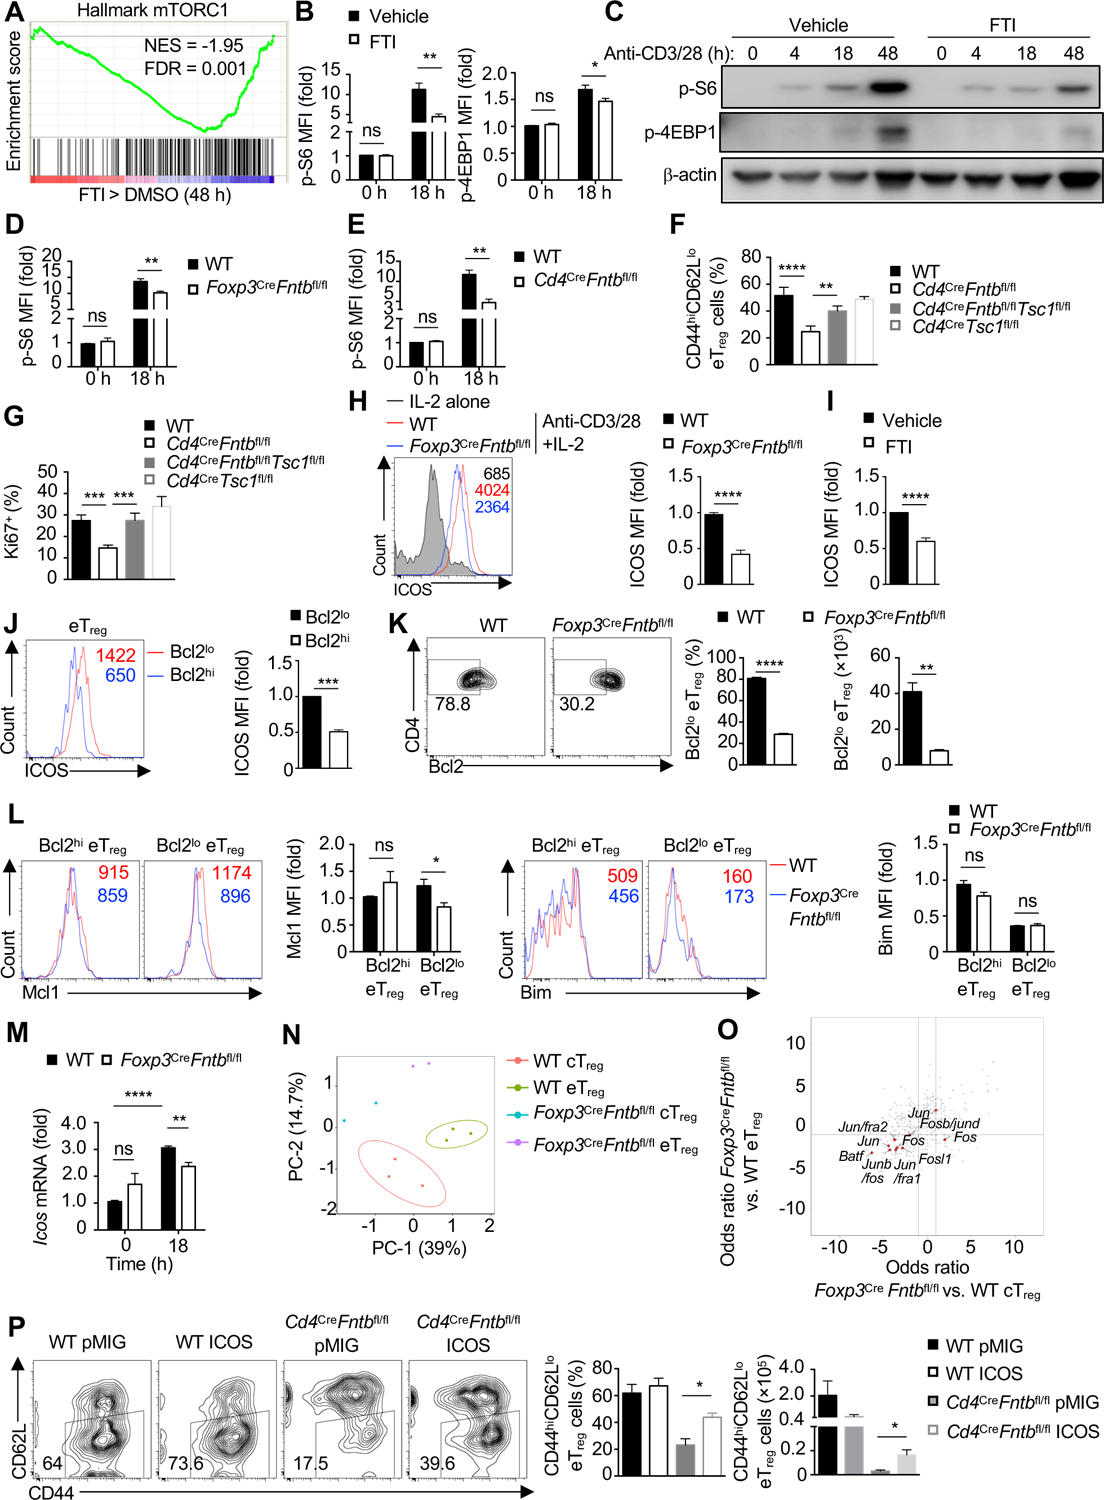
(A) Gene set enrichment analysis (GSEA) of the hallmark mTORC1 pathway in cTreg cells stimulated with anti-CD3/28 plus IL-2 in the presence of vehicle or FTI for 48 h. (B) Quantification of the relative mean fluorescence intensity (MFI) of phosphorylated S6 (p-S6) and p-4EBP1 by flow cytometry analysis in WT cTreg cells stimulated with anti-CD3/28 plus IL-2 in the presence of FTI for 0 or 18 h. (C) Immunoblot analysis of p-S6 and p-4EBP1 in cTreg cells stimulated as in (B) for the indicated times. (D) Quantification of relative MFI of p-S6 in cTreg cells from WT or Foxp3CreFntbfl/fl mice stimulated as in (B). (E) Quantification of relative MFI of p-S6 in cTreg cells from WT and Cd4CreFntbfl/fl mice stimulated as in (B). (F and G) Quantification of percentage of splenic CD44hiCD62Llo eTreg cells (F) or Ki67+ Treg cells percentage in WT, Cd4CreFntbfl/fl, Cd4CreFntbfl/flTsc1fl/fl or Cd4CreTsc1fl/fl mice. (H) Flow cytometry analysis and quantification of ICOS expression on cTreg cells isolated from indicated mice after IL-2 or anti-CD3/28 plus IL-2 stimulation for 3 days. (I) Quantification of ICOS expression on WT cTreg cells stimulated as in (H) in the presence of vehicle or FTI. (J) Flow cytometry analysis and quantification of ICOS expression on WT Bcl2lo and Bcl2hi eTreg-cell subsets from spleen. (K) Flow cytometry analysis (left) and quantification of frequency (middle) and number (right) of splenic Bcl2lo eTreg cells in indicated mice. (L) Flow cytometry analysis and quantification of Mcl1 (left) or Bim (right) expression (based on mean fluorescence intensity, MFI) in splenic Bcl2hi and Bcl2lo eTreg cells from indicated mice. (M) Icos expression in cTreg cells from indicated mice after stimulation as in (B). (N) Principal component analysis plot of nucleosome-free reads of cTreg and eTreg cells from WT or Foxp3CreFntbfl/fl mixed bone marrow chimeras. (O) Odds ratio/odds ratio plot of the predicted enriched motifs in Foxp3CreFntbfl/fl vs. WT eTreg cells compared with Foxp3CreFntbfl/fl vs. WT cTreg from mixed bone marrow chimeras. (P) Flow cytometry and quantification of splenic eTreg cell percentage and number in retrogenic mice [WT or Cd4CreFntbfl/fl bone marrow cells were transduced with pMIG-GFP empty vector (pMIG) or pMIG-GFP-ICOS (ICOS) retroviral vector; see Methods].
Data are representative of two (C) or four (J, K), or compiled from two (B for p-4EBP1, L for Bim, M), three (B for p-S6, D, E, L for Mcl1, P), four (F, G, J, K), five (H) or six (I) independent experiments, with 9 (B for p-S6), 7 (L for Mcl1), 6 (B for p-4EBP1, I, L for Bim, P for WT pMIG and WT ICOS), 3 (E, M, P for Cd4CreFntbfl/fl pMIG), 4 (F, G, J, K, P for Cd4CreFntbfl/fl ICOS) or 5 (D, H) biological replicates per group. *p < 0.05, **p < 0.01, ***p < 0.001, ****p < 0.0001, ns, not significant; two-tailed unpaired Student’s t-test (B, D, E, H–K, L–P) or one-way ANOVA (F, G). Data are mean ± s.e.m. Numbers indicate percentage of cells in gates. Numbers in histograms indicate MFI. Controls were normalized to 1 for each comparison (usually in black bars). See also Figure S5.